How to Decipher Your PageSpeed Insights Report…The Right Way.

Google PageSpeed Insights. We’re guessing you’ve heard it. You’ve probably used it. You might have even spent a lot of time trying to score 100 on it. And yet there’s a good chance you still haven’t gotten the results you’re looking for.

We feel you. The struggle is real.

But we’re going to let you in on a little secret: Scoring 100 on Google PageSpeed Insights doesn’t really matter.

We’ll explain why in a moment.

But first, regather your blown mind and go ahead and analyze your site’s performance on Google PageSpeed Insights.

Take your time.

We’ll wait.

Together we’re going to dissect those PageSpeed Insights Report results to show you what they really mean and how you can use them to improve your business.

Notice, we said business, not website.

That’s an important distinction to make. Not making this distinction is where most go wrong with Google PageSpeed Insights.

In fact, a lot of people use PageSpeed Insights wrong.

Or at least, they don’t use it as best they could.

But no reason why you should be one of them!

Stop Chasing After 100 Scores on PageSpeed Insights

No matter how many blogs, marketing professionals, fortune cookies, horoscopes, SEO experts, or Ouija boards tell you otherwise, don’t waste your time chasing after a perfect score on PageSpeed Insights.

Really, when has chasing perfection not resulted in a massive letdown?

Only once that we know of.

And that was when Pizza Hut created the hot dog-stuffed crust pizza.

Good luck topping that.

Besides, optimizing for a 100 performance score is not in the best interest of your business.

While seeing a nice big 100 feels pretty awesome, it doesn’t automatically mean your online presence is well optimized to grow your business. It just means your website works nicely in Google’s opinion.

But you’re not here to impress Google (at least not 100% of the time). You’re here to grow your brand, revenue, and profit.

Riddle us this, why have it there at all if it doesn’t serve a purpose?

Well, for one, we relate more easily to a single rating, rather than multiple results. As proven by RottenTomatoes. (Sorry, it’s certified fresh or bust for us.)

Ask yourself, what’s more thrilling:


  • Seeing the number “100” in a big, green icon
    – or –
  • Seeing that your largest contentful paint is 1 second


The second one may be more important, but the first is green. GREEN!

But don’t be fooled by fancy colorful one-and-done ratings. They’re not always reliable. As proven by RottenTomatoes.

(Taken: 58%. The Notebook: 53%. Bad Boys II: 23%. Hook: 28% HOOK!? Bad form!)

Google PageSpeed Insights’ performance score is what we like to call a “vanity metric.” It looks good. It feels good. It’s easy to grasp. But ultimately, it doesn’t do you any favors. It’s basically the Krispy Kreme donut of performance metrics.

Far more useful are all the other less-exciting, slightly-confusing metrics that PageSpeed Insights throws at you, and most people ignore. These are the ones that will help you make sound business decisions.

Don’t get us wrong, scoring 100 on PageSpeed Insights is really good. If you can get there, you may be in a position to rank higher on Google. But at what cost?

The last thing you want is to spend a lot of resources trying to get a higher score that could have been better spent on other more valuable aspects of your business, like product development, advertising, content creation, or watching Ozark.

So here at Titan Growth, we always make the recommendation to our clients that they focus on improving the most important aspects of their PageSpeed Insight report, which does not include an ambiguous grade.

Point being, it’s very easy to get caught up chasing a perfect score on PageSpeed insights while forgetting the bigger picture.

Find the Right Performance Results for Your Business

All that said, we still get asked a lot:

What is the best Google PageSpeed Insight score for my site?

If you have your sights set on getting the best grade possible, find that perfect balance between improving performance and improving your business.

That balance usually lies right above your competitors.

When it comes to SEO, you’re not looking to win the Internet. Just beat your competitors. So if your webpages can outperform those of your competitors in SERP, you’re in a good place.

One of the great things about Google PageSpeed Insights is that anyone can use it for any site. So instead of chasing after a 100 Insight score, the following will far likely better serve your business:


  1. Identify your high traffic pages
  2. Analyze those webpages in PageSpeed Insights
  3. Analyze your competitor’s similar webpages
  4. Tally and compare the scores
  5. Optimize your webpage to have a higher score than your competitors


There’s a good chance you won’t need a 100 to outperform your competitors.

Whatever that number is that places you above them, that’s most likely what the ideal performance score is for your site.

But again, this is only if you absolutely feel the need to get a good grade. A far better strategy would be to focus on improving the more important metrics found within a Google PageSpeed Insights report.

Cue…

How to Read a PageSpeed Insights Report

Who doesn’t love reading reports?

Answer: Pretty much everyone.

Merely uttering the word is enough to turn the stomach and conjure images of having to sheepishly hand over our middle school report cards. Who knew F- was even a thing?

But don’t worry, reading a Google PageSpeed Insights report doesn’t have to be terrifying, humiliating, or boring.

Ok, well, they’re still pretty boring. It is a report after all.

But it can be less boring. Especially since if you read this report correctly, it can greatly benefit your business.

So let’s decipher these digital hieroglyphics, together, one section at a time.

Performance Score

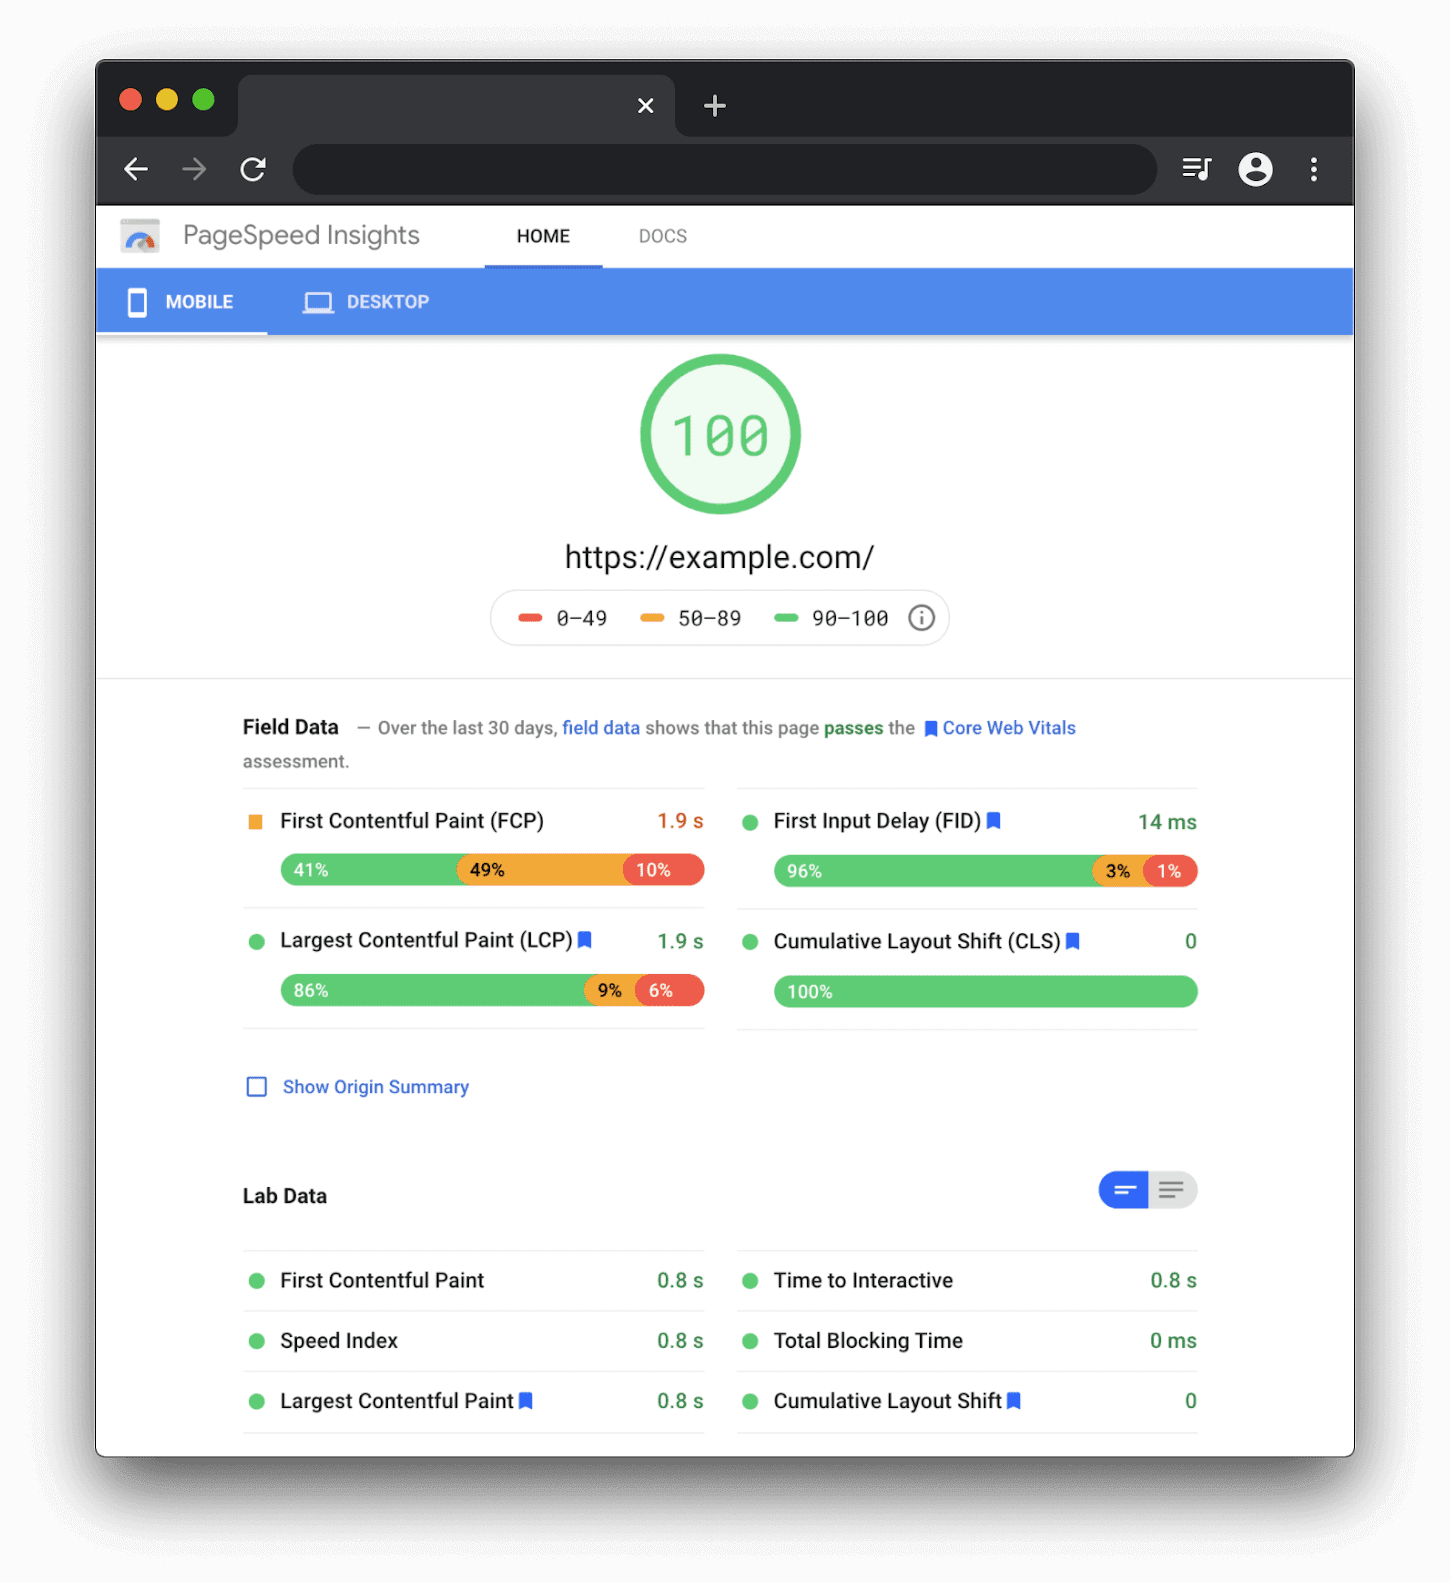
This is the big number that appears at the top of the report. You know, the one we just said you can totally ignore.

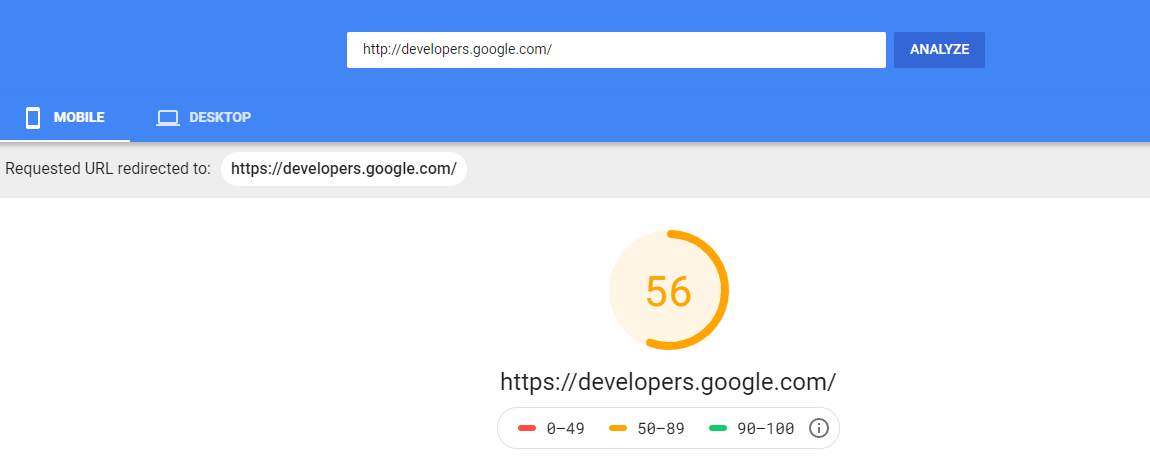
This score is determined by analyzing Lab Data (see below) and subjectively attributing a number score to the results. Google considers a score of 90 or above good. Anything from 50 to 90 needs improvement (even Google’s developer site could use a little work by their own standards). Anything below 50 is considered poor, or as we know it better as: an F-.
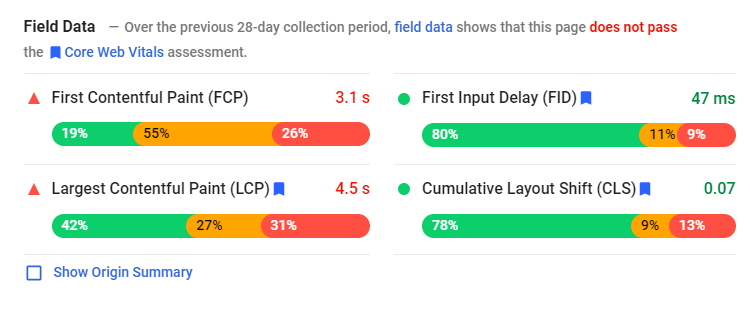
Field Data

Field Data is an aggregate collected from actual users who load and interact with your page. These metrics have been collected by Google  over the past 30 days, and are averaged into a single total for four different categories:


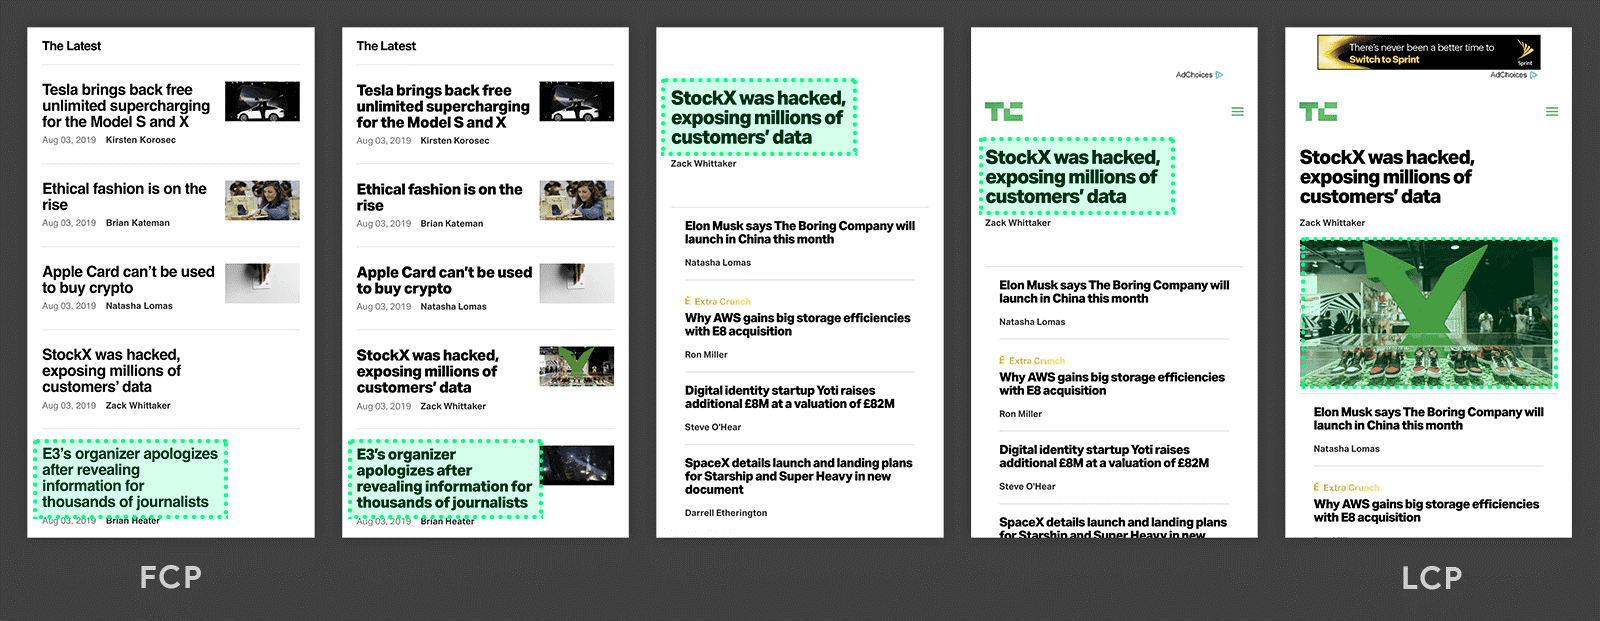
  • First Contentful Paint (FCP) – Measures how long it takes for the first content (like text or an image) to appear on screen.
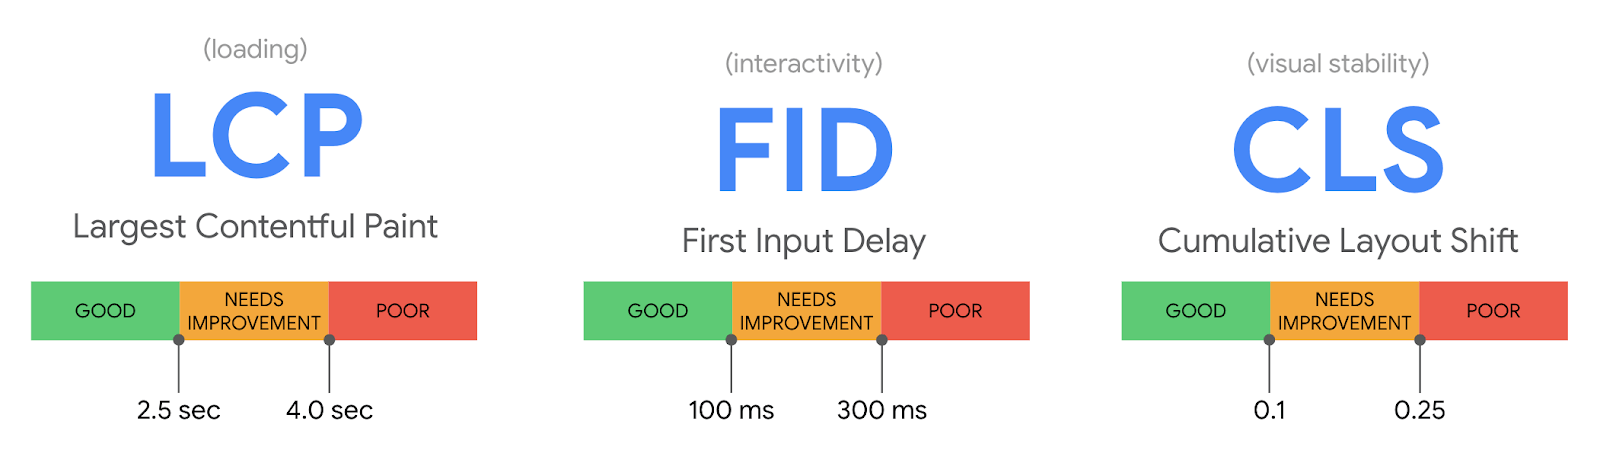
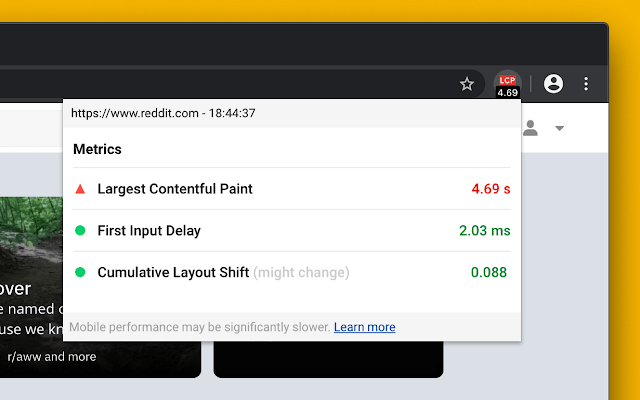
  • First Input Delay (FID) – Measures the time between when a user first interacts with a page (like clicking a link or tapping a button) to when the browser responds to that interaction.
  • Largest Contentful Paint (LCP) – Measures how long it takes the largest content element (like an image, video, or text block) to appear.
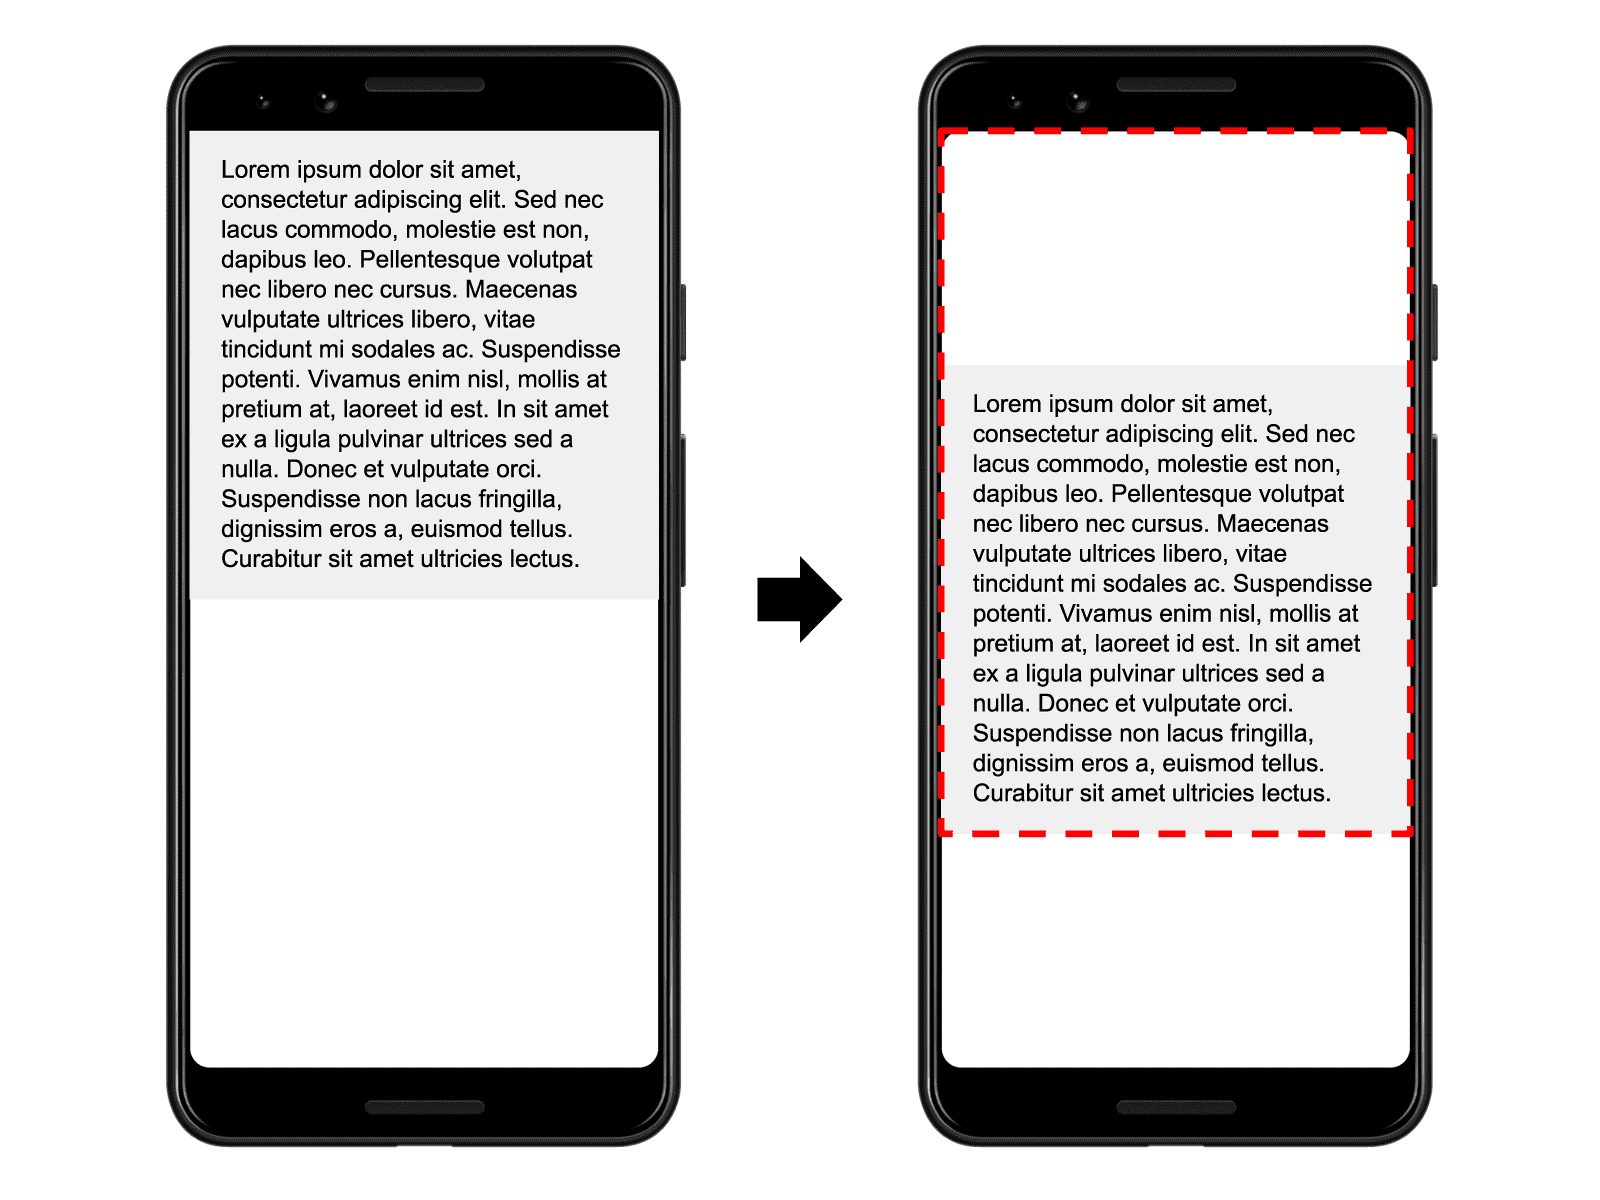
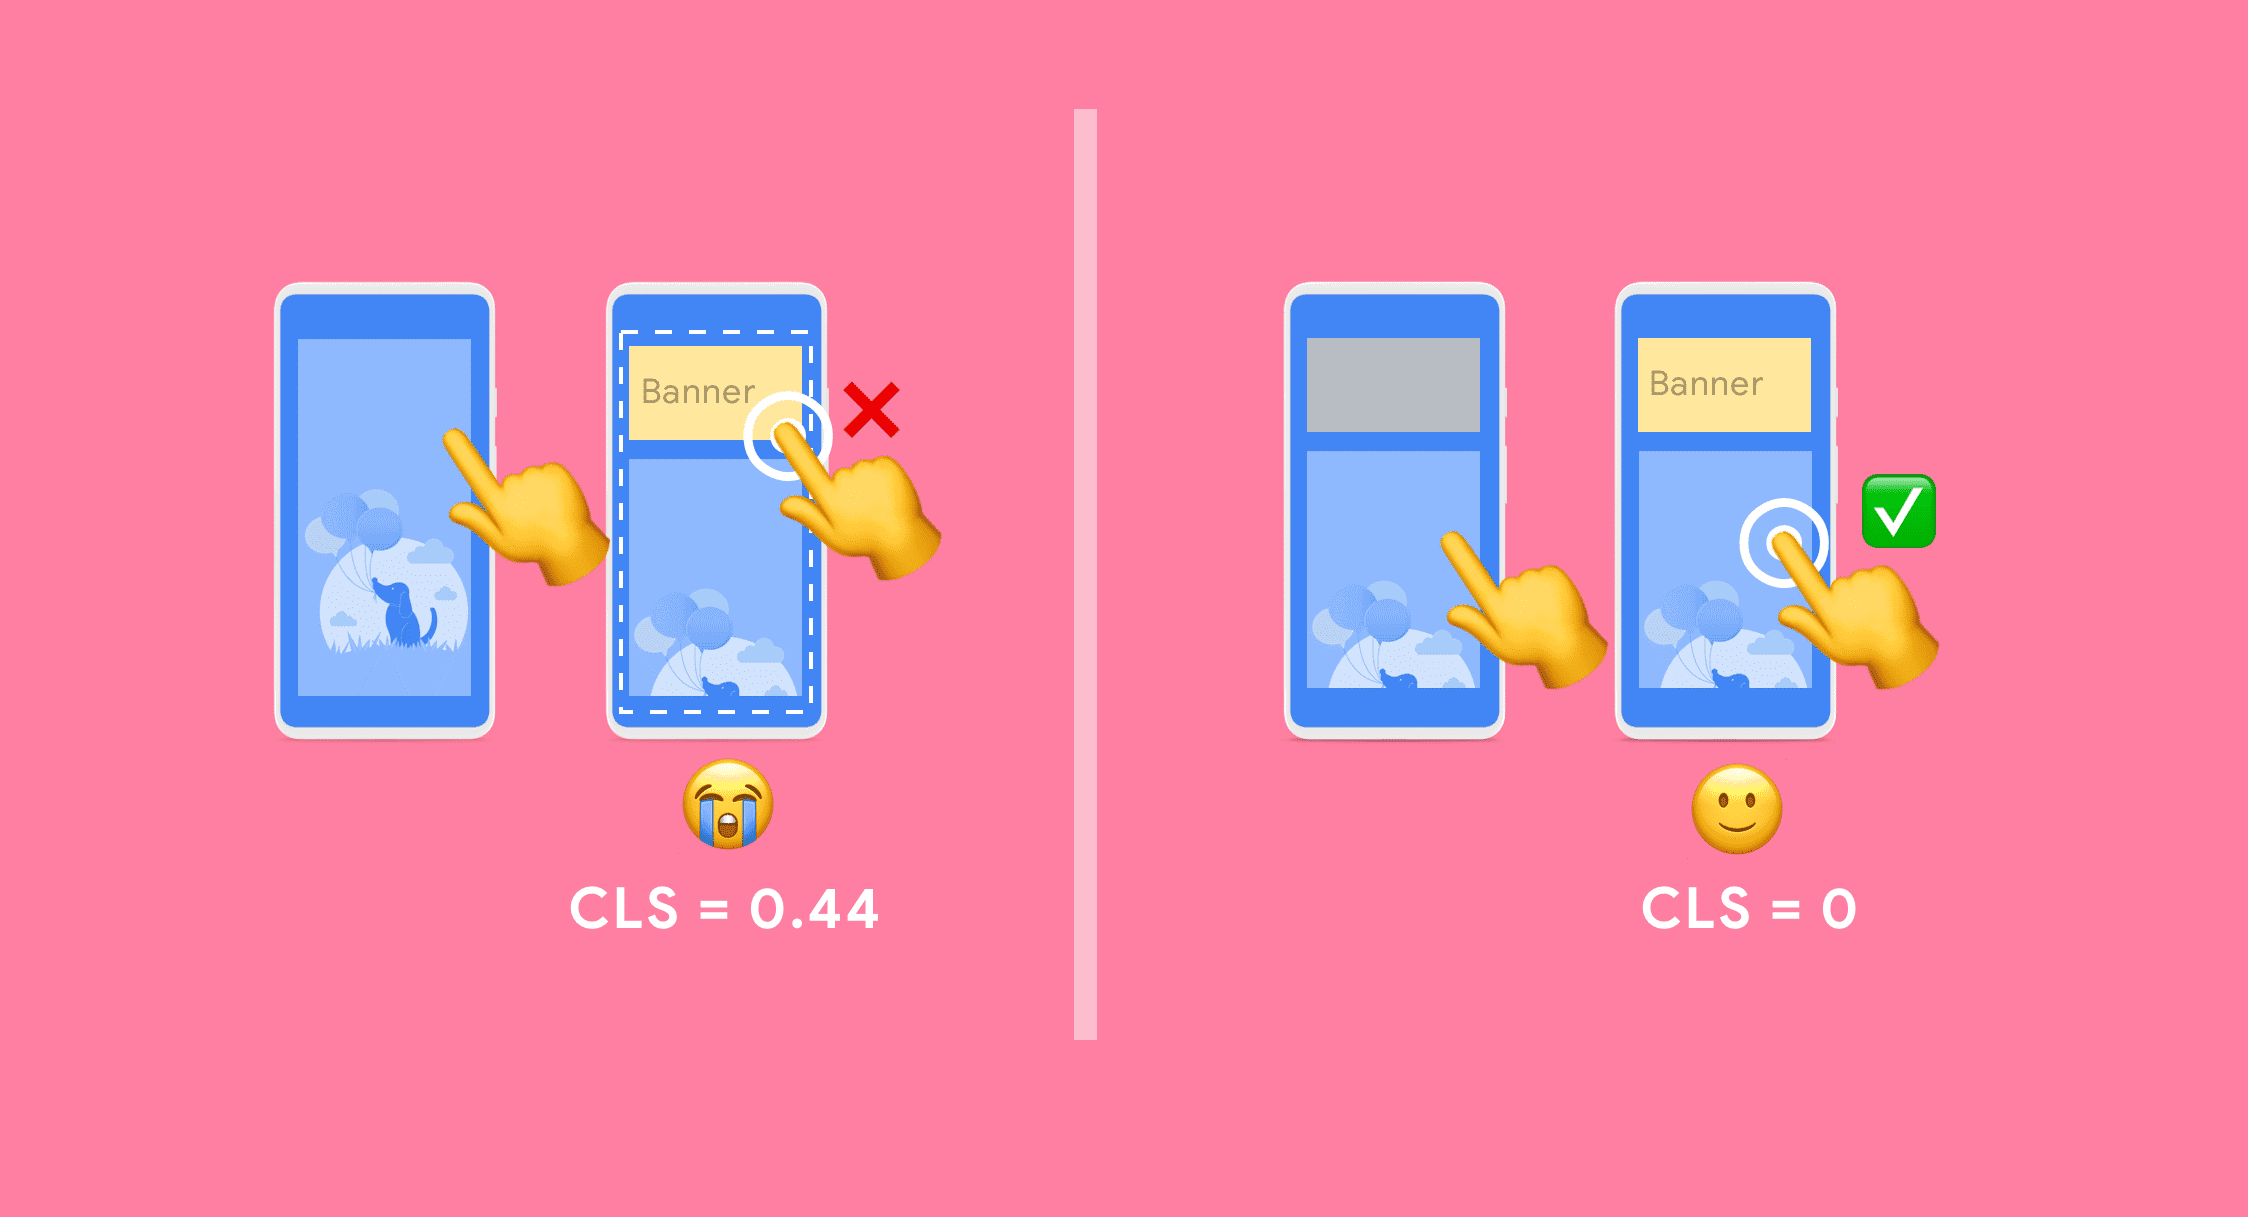
  • Cumulative Layout Shift (CLS) – Measures a page’s stability, and whether there are any visible page element changes position (or shift) at any time.

The multi-colored bar that appears beneath breaks down how the final tally was reached, and what percentage of page loads within the past 30 days were either good (green), not so good (orange), or poor (red).

The tallies for these categories are far more important than that generic performance score at the top of the report. Ideally, your page should have the following for each:


  • First Contentful Paint of 1 second or less
  • First Input Delay of 100 milliseconds or less
  • Largest Contentful Paint of 5 seconds or less
  • Cumulative Layout Shift of 1 or less


If it does, then what are you still doing here? You should be out on the town partying it up like an SEO rockstar. If it doesn’t, keep on reading, we’ve got some work to do.

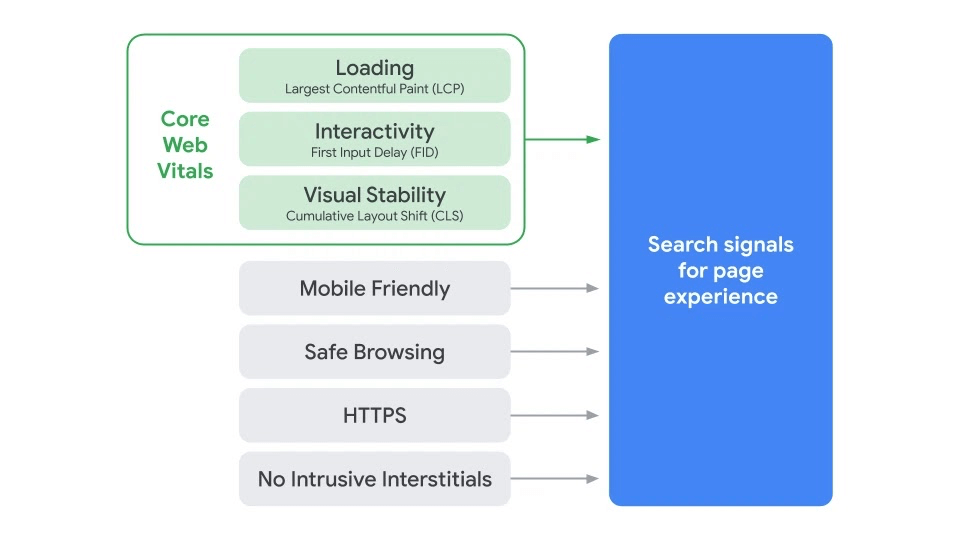
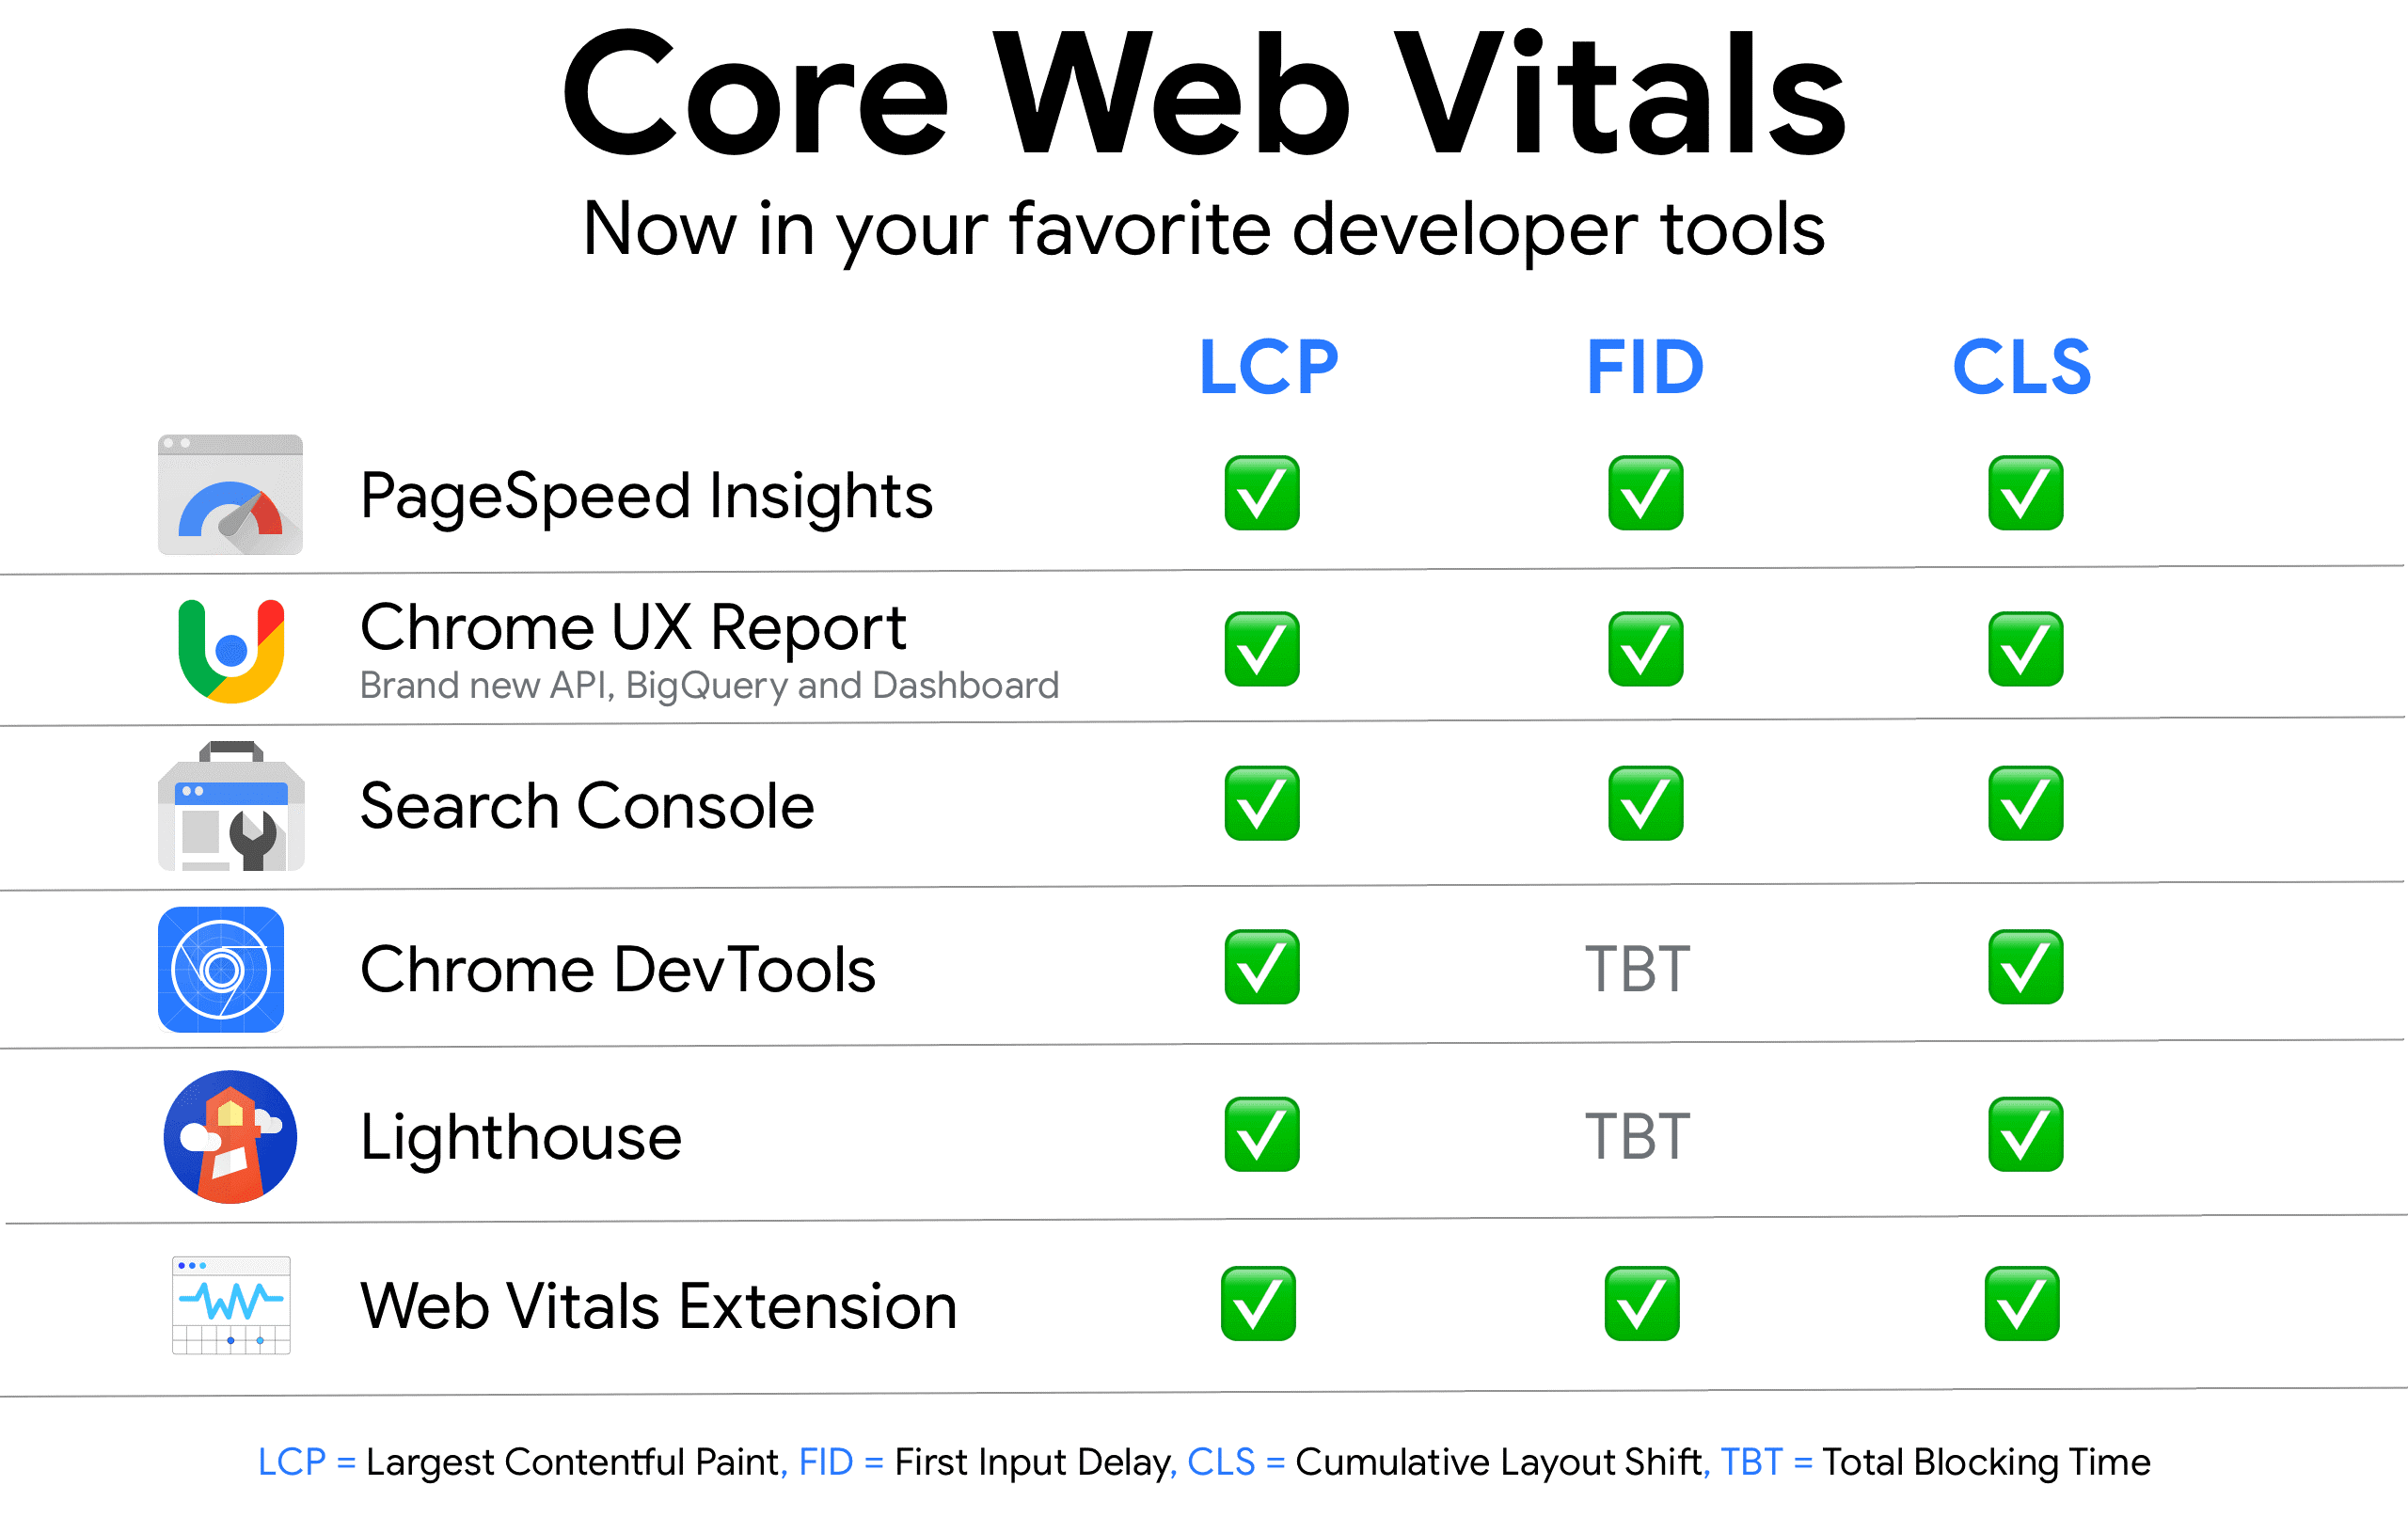
The latter three metrics comprise what is known as your Core Web Vitals. Google lets you know plain and simple whether your page experience is up to snuff by listing whether it “passes” or “does not pass” its Core Web Vital test.

What does it mean if your page doesn’t pass?

Well, you probably shouldn’t show this report to your parents for one.

Core Web Vitals are the ranking signals Google users to determine page experience, which is kinda big thing. So big, in fact, we wrote an entire guide on everything you need to know about page experience and Core Web Vitals. That guide also shows how to optimize for Web Vitals. So if your numbers are less than ideal, be sure to check it out.
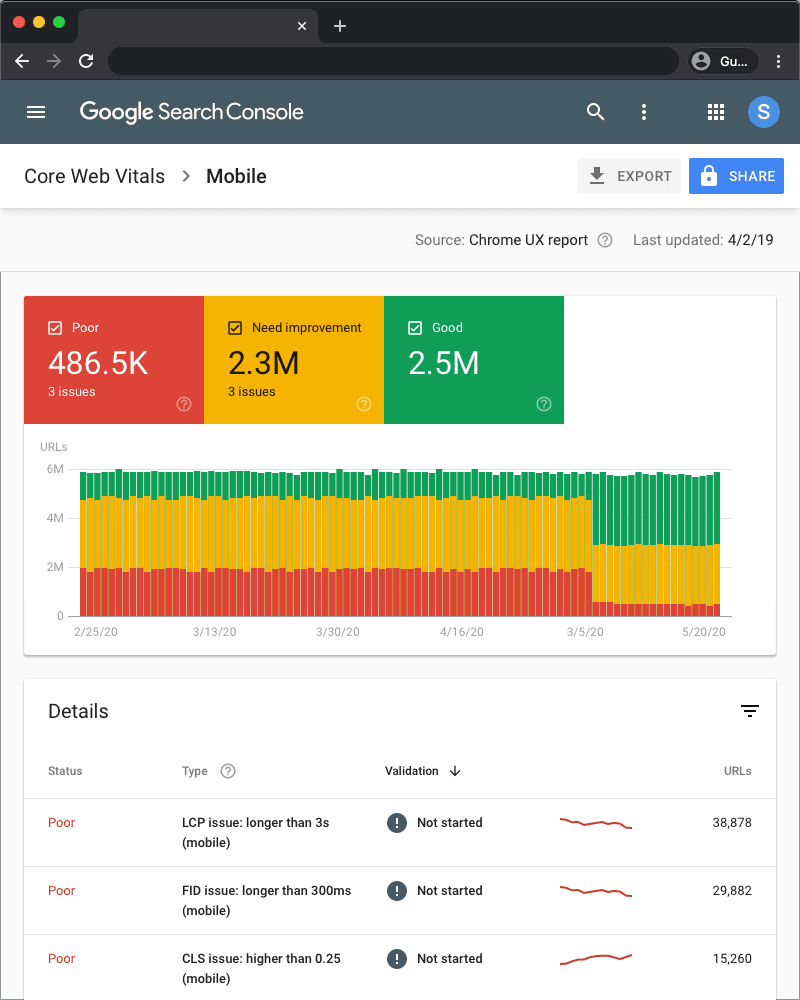
Origin Summary

You probably ignore this section every time. Don’t. It’s a great reference.

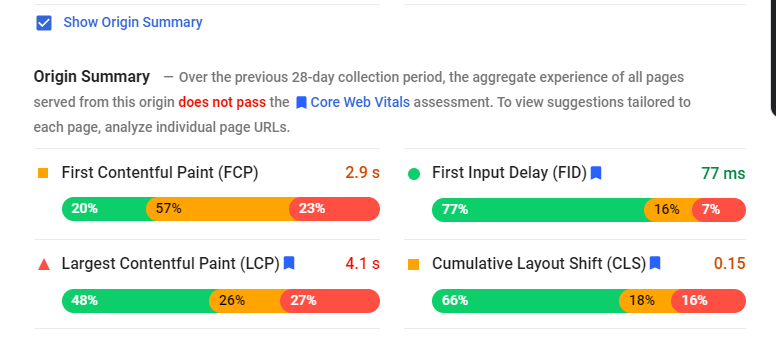
When you enter a URL into Google PageSpeed Insights, the results pertain only to that unique page. To get sitewide performance data, you need to look at the Origin Summary.

Check the “Show Origin Summary” box to view the average loading speeds across your entire site. You can then compare these results to the Field Data of a specific page to see if that page performs better or worse than your site as a whole.

Use this to benchmark pages, and prioritize which need the most help while using your site’s best-optimized pages as a reference for pages that need better optimizing.

Lab Data

Lab Data are metrics taken from a simulation of how your page loads on a single device under a fixed set of conditions. Think of it as the control group of testing your page.

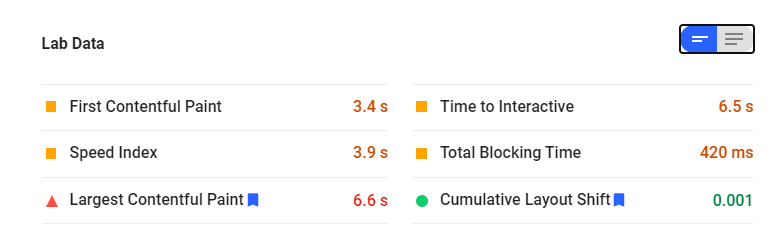
Lab Data consists of:


  • First Contentful Paint (FCP)
  • Time to Interactive (TTI) – Measures how long it takes for a page to become fully interactive. An ideal result is 8 seconds or less.
  • Speed Index – Measures how quickly the content of a page appears. An ideal result is 3 seconds or less.
  • Total Blocking Time (TBT) – The total amount of time a page is blocked from responding to user input, such as mouse clicks, screen taps, or keyboard presses. An ideal result is 300 milliseconds or less.
  • Largest Contentful Paint (LCP)
  • Cumulative Layout Shift (CLS)


You’ll notice that some of those categories are shared between Field Data and Lab Data, but most likely show different results on your report.

The Difference Between Lab and Field Data, and Why You Should Care

In a nutshell, Field Data is collected from users. Lab Data is generated by a Google algorithm.

But the more-telling difference is found with two factors:


  • Perceived Performance – How fast a user thinks your website is
  • Actual Performance – How fast your technical stats say it is


Field Data focuses on conveying perceived performance, while Lab Data more closely aligns with actual performance. Which means if you were to only care about one of these, you would want Field Data. That’s because when it comes to SEO and optimizing your webpages, it’s what the user thinks that really matters, not the technical wizardry going on behind the scenes.

That comes straight from the horse’s mouth. According to Google, Field Data is more reliable and “probably a better indicator for how real users are experiencing your website than lab data.

But don’t totally ignore Lab Data.

Actually, it’s impossible to ignore it on the PageSpeed Insight report because the Performance Score at the top, and Audit sections below, are based solely on Lab Data.

Knowing this is really helpful in deciphering which performance metrics Google prioritizes when ranking sites. Google might not be an open book on the 200+ ranking signals it uses, but it is transparent about how they weight Performance Score.

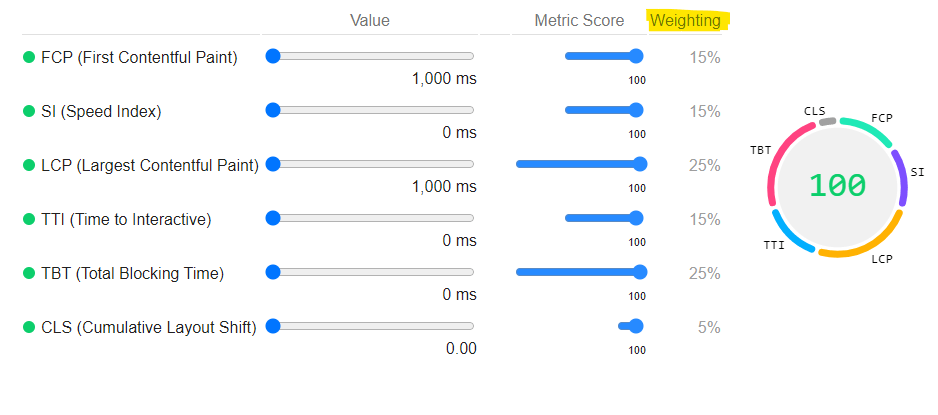
Check out this nifty scoring calculator to see how each component impacts the overall score.

Remember, Performance Score is Google’s arbitrary opinion of your page’s speed. And since Google dictates who ranks where in their search engine, based on that table above, they care a lot more about Total Blocking Time and Largest Contentful Paint, than say Cumulative Layout Shift. So don’t spend all your time fixing wonky content shifts over improving your pages’ response time.

Taking this one step further, when prioritizing your SEO workflow, we recommend:


  1. First, optimize your site for the Field Data (going from highest weighted to lowest)
  2. Then, optimize your site for the Lab Data (going from highest weighted to lowest)

One final note: Since your page and that of a competitor likely get completely different visitors, there are too many variables to accurately say which performs better by looking just at Field Data. However, Lab Data tests both pages in the same exact environment and presents a more accurate comparison between the two.

So we recommend using Lab Data (over Field Data) when performing competitor analysis.

Alrighty then. Now that we know all there is to know about the data in our report, let’s see how to improve it.

The Best Ways to Address Google’s Performance Audits

When running a Google PageSpeed Insights test, most people:

  1. Look at their Performance Score, and get either really happy or sad
  2. Scroll right past the Field Data and Lab Data as fast as they can
  3. Dive headfirst into fixing everything spit out in the Audit sections

Because who doesn’t love being audited?

Answer: Pretty much everyone.

We do, however, like being given solutions. So, the audit section gets all the glory while the data sections get ignored, just like the kid nobody wants on their kickball team.

The three sections that comprise the PageSpeed Insight audit are:

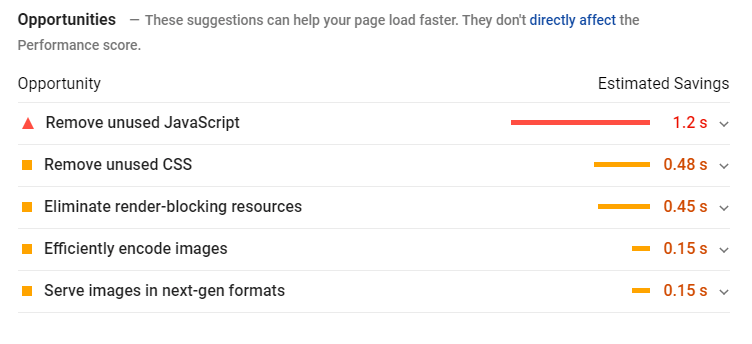
Opportunities – Provides suggestions on how to improve page load time. The tallies next to each are an estimate of how much that issue is impacting your overall page load.

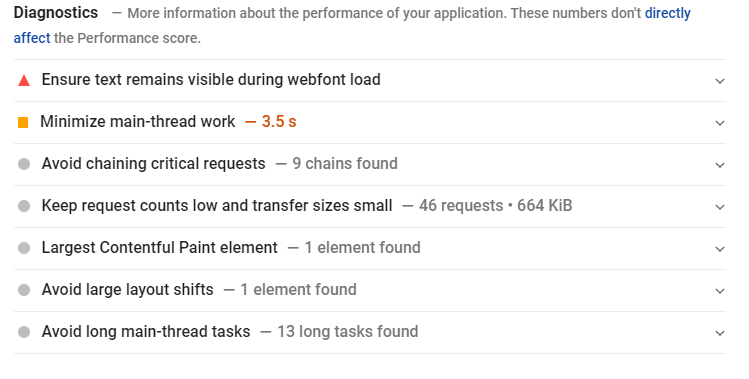
Diagnostics – Assesses specific aspects of page performance, with recommendations for optimization.

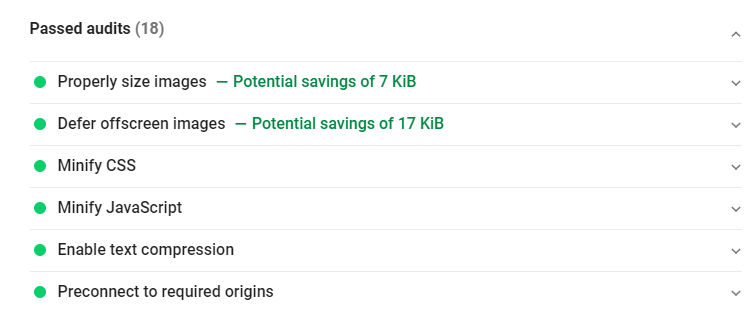
Passed Audits – Indicates the audits that have been passed by a page.

First and foremost, don’t break your back trying to fix every single item listed in the Opportunities section. You’ll likely drive yourself mad trying to shave off milliseconds.

Instead, use these suggestions as a guide to see what areas you should focus on.

For instance, if you see any issues related to images under “Opportunities,” rest assured it’s because you’re not optimizing your images as best you should. But don’t worry about figuring out how to “efficiently encode images” or “service images in next-gen formats.” All you should care about is optimizing your images using best practices before uploading them to your site (and avoid using widgets like those that display your Instagram feed).

Nine times out of ten, that will suffice for resolving image issues.

(For those confused about “next-gen formats”: Google has decided on behalf of the Internet that JPEG, PNG, and SVG images are no longer good enough. So, they push the use of more modern, higher-compressed versions that very few people have ever heard of. However, next-gen formats aren’t supported by every browser and are complicated to convert to. Making this is a perfect example of why chasing after a Google-recommended solution is not always the best course of action.)

With that in mind, we recommend referring to the following tutorials to improve load time (and your page’s actual performance):


As well as the following to improve page experience (and your page’s perceived performance):

The reason we recommend heading straight to those tutorials, rather than explaining what each line item in the audit means, is because, at the end of the day, Google PageSpeed Insights is not the end-all-be-all of your SEO strategy.

It is a report. A mere snapshot of your page performance.

If we focus solely on implementing the report’s recommendations instead of zeroing in on what the data is telling us, we miss the point.

Conclusion: PageSpeed Insights Is About Your Business, Not Google Rank.

As hard as it is to believe, Google is not the authority on webpage performance. Nor are they the authority on your customers. PageSpeed Insights is a testament to that. The scores are subjective, and the audit recommendations are based on Google’s own preferences.

Google PageSpeed Insights is, however, a great reference. It is a tool, a means to an end, that can help you determine how to optimize your webpages to create the best experience possible.

There is a reason why it’s not called Google Engine Optimization. (Although some days, it can feel like it!)

SEO is about more than just appearing higher in a Google search result. It’s about optimizing your online presence to best engage your brand’s target audience.

So use the data in your Google PageSpeed Insights report to help you do just that.

Page Experience 101: Core Web Vitals and Google’s Newest Ranking Factor

Is your website’s page experience up to snuff? It better be, because Google is making it a priority of SEO. So, call your favorite SEO doctor, it’s time to check your Core Web Vitals.

Google is a fickle beast. Rarely are they satisfied with the performance of search or how you’re optimizing for it.

So, they tinker.

A lot.

Most of the time, though, no one ever knows precisely what’s going on in that big, beautiful, algorithmic brain of theirs. There’s said to be over 200 ranking factors for search results, but no one really knows for sure exactly how many there are.

However, every once in a while, Google lets us in, opens up, and increases our control over our chances of winning their hearts and coming out on top.

Today is that while.

Page Experience: There’s a New Ranking Factor in Town

You walk into a search bar. Look around. Then see it.

Exactly what you’ve been looking for.

The Perfect Page.

It immediately speaks to you… and sucks you right in.

You strike up a conversation and hit it off. This page looks great, is really interesting, and has everything you were looking for. And it’s down to load. What a find! You love fast pages.

But there’s something more to it than just that. An intangible. A special something that is seemingly impossible to quantify.

But Google has quantified it.

And it’s called Page Experience.

Welcome to the new age of online searching.

Remember how we discussed improving user experience was one of the top 5 benefits of SEO? We didn’t just pull that out of a hat. Google has consistently said that user experience (UX) is important. That’s because they are committed to creating a better user page experience across the web.

In fact, they’re making it a priority.

Google recently announced they will incorporate page experience into their ranking algorithm in 2021.

What does this mean?

Well, for one, you better start caring how easy it is for users to pick up your pages at the bar. Beyond that, you need to tune up your page experience from top to bottom because simply having a good looking page isn’t going to cut it anymore.

Your pages have to have that special something, inside and out.

But what is a great page experience?

In a nutshell…

Page experience is the quality of a user’s experience on a web page.

It is Google’s latest and greatest ranking factor. Well, actually, to be precise, it is multiple ranking factors combined into one super ranking factor.

Page experience is the Voltron of ranking factors.

In one fell swoop page experience takes into account site security, server connection type, mobile-friendliness, content accessibility, and Core Web Vitals (a new metric that we’ll meet in a second).

According to Google, page experience is a set of ranking signals that “measure how users perceive the experience of interacting with a web page beyond its pure information.

In other words, it’s not all about looks.

(Although let’s be serious. Looks matter, too.)

The best SEO has always been about meeting expectations and tickling the fancy of users, whether it’s through copy, images, load time, or mobile-friendliness. Google’s page experience ranking factor just hammers the point home.

Think of page experience as a holistic view of your pages. It measures whether or not a web page is ‘the complete package.’ Whether it has that X factor — that special intangible something that deserves it to rank higher than all the rest.

Does that sound like your page?

If someone met your page on a SERP and struck up a conversation, would they have a deep, meaningful experience that leaves them coming back for more? Or would they find something shallow and vapid that has them heading for the door and reassessing their life choices?

No one wants the latter. So, your web pages must be optimized for page experience. But don’t worry if they’re not, or you’re not sure how to do so, because that’s exactly what we’re going to cover here.

Let’s dive right in and see how page experience will affect you, and what to do about it.

How Will Page Experience Affect Your Ranking?

If your page enables users to get more done and engage more deeply, it will be looked upon favorably by Google for having a great page experience. If your page has a bunch of junk like annoying interstitials and Dumb and Dumber gifs, or weak content that prevents someone from finding the valuable information on a page, it will be looked upon less favorably by Google for having a poor page experience.

That’s the basic role Page Experience will play in how well your pages rank.

But it’s not quite that simple.

(Side Note: Google actually really likes Dumb and Dumber gifs because who doesn’t think that improves page experience?)

There are two very important things to know about page experience right off the bat:

  1. It works at the page level (not site-wide)
  2. It will not affect everyone

Regarding the first, when it comes to page experience, Google cares about the performance of specific pages. This is worth mentioning because a lot of people sometimes think what applies to their site automatically applies to every page on that site.

Not all pages are created equal. Write that down.

For instance, sometimes people will put their root domain into GTMetrix or Google PageSpeed Insights and think the results relate to their entire site. They do not. They only apply to your homepage. You need to put in each page’s unique URL to see if that page is meeting page speed standards.

That’s because Google ranks pages, not sites.

So, when considering how page experience will affect your ranking, make sure you analyze on a page-by-page basis.

Second, page experience is only one of the hundreds of ranking signals Google considers when generating search results. While page experience is undoubtedly important, it might not come into play for your pages as much as other signals.

When You Will Likely Not See a Drop from Poor Page Experience

If the search queries you’re targeting aren’t competitive, as in not many others are creating content for them, then you will likely not see a big difference in rank due to page experience. That’s because a great page experience doesn’t override having great page content.

Above all else, to ensure your pages rank well, make sure they have the best information possible. (Content is king, and always will be.) A page can still rank well so long as it thoroughly answers a user’s query, even if it’s on-page experience is mediocre.

When You Will See a Drop from Poor Page Experience

When several pages are vying for the same spot in search, each with highly relevant, well-written information, page experience can be the deciding factor for who comes out on top.

If your web pages appear in competitive searches, then page experience can be crucial for ranking well, and it is something you should definitely optimize for. To do so, you will need to address several specific ranking signals on your pages, including an all-new metric called Core Web Vitals.

What are Core Web Vitals?

Checking vitals is all the rage these days. So why not do the same for our web pages?

Thanks to Google, we now can.

With Web Vitals.

Sure, that sounds like an ad slogan for a kid’s cereal, but like Cinnamon Toast Crunch, Web Vitals make the world a better place.

Web Vitals is a program created by Google that shares with site owners and web developers the ranking signals it takes to deliver a great user experience online.

Remember how at the start we said knowing what Google thinks isn’t so easy?

Well, Web Vitals is Google’s attempt at letting you in on some of the secret sauce that makes the web tick. The initiative aims to “simplify the landscape, and help sites focus on the metrics that matter most, the Core Web Vitals.

In other words, page experience is universally measured by a set of “core vitals.”

Some aspects of user experience are site and context-specific. But other aspects are common to all web experiences, whether you sell marketing software or squirrel picnic tables.

This standard set of signals is Core Web Vitals.

Core Web Vitals are a subset of Web Vitals. They apply to all web pages. They are what give a website its powers. They are a metric created by all digital things. They surround us and penetrate us; they bind the Internet together.

Remind you of anything?

Yep, that’s right. Core Web Vitals are exactly like… midi-chlorians.

A page with healthy Core Web Vitals focuses on three aspects of user experience:


  • Loading
  • Interactivity
  • Visual stability


(In case you’re wondering, visual stability is a fancy way of saying “not an annoying assault on the eyes.”)

Each of those aspects is, in turn, measured by one of three new metrics catering to page experience. (There’s a whole lot of new coming out of Google this year for SEOers.)

Pay close attention, because you’re going to be seeing a lot more of these metrics in the future.

Here’s how Google defines each:

  • Largest Contentful Paint (LCP): Measures loading performance. To provide a good user experience, sites should strive to have LCP occur within the first 2.5 seconds of the page starting to load.
  • First Input Delay (FID): Measures interactivity. To provide a good user experience, sites should strive to have an FID of less than 100 milliseconds.
  • Cumulative Layout Shift (CLS): Measures visual stability. To provide a good user experience, sites should strive to have a CLS score of less than 0.1.

 Unless you’re an SEO nerd like us, those names are probably gibberish to you.

So here’s a more meaningful breakdown of each:

Largest Contentful Paint

Largest Contentful Paint measures how long it takes the largest content element to appear (or get “fully painted”) for users. The elements considered for LCP are:

  • <img> elements
  • <image> elements inside an <svg> element
  • <video> elements (the poster image is used)
  • An element with a background image loaded via the url() function (as opposed to a CSS gradient)
  • Block-level elements containing text nodes or other inline-level text elements children

Largest Contentful Paint marks the point when the main content of a page has likely loaded. It’s an offshoot of First Contentful Paint (FCP) and Time to First Byte (TTFB), and Google has prioritized it as the best indicator of page load speed with regard to relevant user page experience.

First Input Delay

First Input Delay measures the length of time between when a user first interacts with a page to when the browser responds to that interaction. These interactions could be anything from:

  • Clicking a link
  • Tapping a button
  • Using a custom JavaScript function


No one likes to wait around for things to happen, so Google’s found a way to gauge that feeling. FID demonstrates a user’s first impression of your page’s load responsiveness and quantifies how a user might feel when interacting with it.

The higher your FID, the less usable your page is. The lower your FID, the better your page experience and happier your users will be.

Cumulative Layout Shift

Cumulative Layout Shift measures delightfulness. It looks at any unstable elements on a page and calculates their impact on the visual stability of the page.

A layout shift is what happens whenever a visible page element changes its position from one frame to the next. For example, you might be trying to read something on a page when all of a sudden, the text inexplicably shifts down 100 pixels, and you have to scroll to find your place.

That’s not delightful. In fact, it sucks.

It’s happened to all of us, and it’s really annoying. Well, Cumulative Layout Shift takes that annoyingness into account by tallying all the unexpected layout shifts that occur on a page.

The lower the CLS, the more delightful a page and better the experience.

And with that, you’re fully acquainted with the three aspects of Core Web Vitals.

Since these are things that apply to all sites, they are something every site owner should be aware of and measure. So, to ensure you’re providing the best possible page experience, let’s see how well your site measures up.

How Do You Measure Core Web Vitals?

Fortunately for us, there are a lot of different ways to measure Core Web Vitals. In fact, all of Google’s web developer tools support doing so. These include:


Google’s web.dev explains in detail how each tool can be used to measure Core Web Vitals, as well as provides a recommended workflow for doing so.

But most site owners will likely get what they’re looking for using the following:

Web Vitals Chrome Extension

This Chrome extension is by far the easiest and quickest way to see how well your page performs for each Core Web Vital.

By providing a real-time snapshot of page experience, you can catch issues early on in development and ascertain if fixes are needed.

Google Search Console

Google Search Console helps you quickly identify all the pages across your site that may have poor Core Web Vitals and require immediate attention.

Using Search Console to get a complete list of page’s with poor experiences should become a part of any thorough SEO audit.

Google PageSpeed Insights

Google PageSpeed Insights measures Core Web Vitals while also providing actionable recommendations on how to improve page experience. In doing so, it actually combines aspects of two of the more complex measurement tools listed above (Chrome UX Report and Lighthouse) into a more user-friendly interface.

PageSpeed Insights measures page experience performance using two different ways:

  • Field Data – Based on how real users load and interact with the page across a variety of devices and network conditions.
  • Lab Data – Based on how a simulated “average user” loads of a page, using a consistent, controlled environment on a single device and fixed set of network conditions.

Each is useful to know, and will indicate (with the color green) if your page meets the threshold for Core Web Vitals, with regard to the specific real-time test (field data) and on average (lab data).

You’ll notice in the screenshot above, at the top PageSpeed Insights also indicates whether the page “passes” or “does not pass” the Core Web Vitals assessment.

Isn’t that nice?

Measuring Core Web Vitals doesn’t get any easier than that.

The rest of those other tools that we didn’t cover help you dive deeper into your page experience. However, most site owners’ main focus is running a business (and not developing websites). So, they will likely want to consult with an SEO expert to fully diagnose and fix page experience.

Though, there’s no reason why you can’t get started doing it yourself.

Optimize Your Page Experience Like an SEO Champ

Because page experience is the Voltron of ranking factors, there is no one simple way to fix poor performance. Rather, to optimize page experience properly, you need to address each of the elements that comprise it.

Below is a breakdown of some of the most important page experience elements and what you can do to improve them on your pages. Then, we wrap up with some specific tips for Core Web Vitals. Follow these, and you’ll be primed to provide your users (and Google) with an experience that rocks their world.

Mobile-Friendly

Pretty straightforward. Run your page through Google’s Mobile-Friendly Test. If it passes, you’re good to go. If it fails, fix the problems provided.

Google also provides a tutorial on how to be mobile-friendly. Or you could consult with us, starting with our list of ways to avoid being penalized for mobile-unfriendliness.

HTTPS

Is your page served over HTTPS (Hypertext Transfer Protocol)? Unsure? Take a gander at your URL. Is there an ‘S’ after the ‘HTTP?’ If not, your site’s server connection isn’t secure. You can also open the page in Google Chrome and view the security status shown in the web address bar.

Which of the following do you see?

It should be the first one. If it isn’t, Google no likey. Better secure your site with HTTPS or better yet get an expert to help with your HTTPS site migration.

Safe-Browsing

Giving someone a virus that destroys their computer and sends them into a deep depression is a bad page experience. Make sure your page doesn’t do that.

Specifically, make sure your web page doesn’t contain any malicious or deceptive content. Though there’s a good chance if it does, you’re not even aware.

So how do you become aware?

Open a Security Issues report in Google Search Console.

If any security issues are detected, select “learn more” and address the issue to ensure the page is safe to browse.

No Intrusive Interstitials

Accessibility is a big part of page experience. If a user has to cancel out of a quagmire of popups, ads, download requests, cookie notices, and newsletter signups (aka interstitials), that user is going to get pretty annoyed pretty quickly.

So be sure to avoid content blocking with many intrusive interstitials because no one likes a content blocker.

Core Web Vitals

A page with great Core Web Vitals hits all the right places. Namely, it provides a good user experience, loads fast, is responsive, and remains visually stable.

Here are some tips for optimizing Core Web Vitals.

Optimizing Largest Contentful Paint

LCP is all about speed. The biggest culprits of a sluggish site are:

  • Slow server response times
  • Render-blocking resources (like JavaScript and CSS)
  • Slow resource load times
  • Client-side rendering

The more efficiently your page loads, the better your page experience. To achieve this and prevent those issues from holding you back, look no further than our guides on 7 Ways to Improve Page Load Speed and Reduce HTTP Requests Like a Pro.

Optimizing First Input Delay

Remove any impediments preventing users from interacting with your page is the key to FID. These impediments might result in:

  • Prolonged JavaScript execution time
  • Long tasks
  • Endless data-fetching
  • Waiting on third-party scripts

Again, consult our Improve Page Load Speed Tutorial and HTTP Requests Rundown. (Trust us, you’ll never know your pages could move so fast). Some highlights relevant to reducing FIP include minifying and compressing your JS, deferring unused JS, reducing long-lasting JS tasks with code splitting, and implementing a web worker.

Optimizing Cumulative Layout Shift

CLS is about not confusing the crap out of your visitors. Some common causes of a poor CLS include:

  • Images, ads, embeds, and iframes without dimensions
  • Dynamically injected content like banners and forms
  • Web Fonts causing FOIT or FOUT

To counteract these layout shifts try:

  • Always including width and height size attributes on your images and video elements
  • Styling placeholders for dynamic banners, forms, embeds, and iframes
  • Statically reserving space on the page for ads
  • Controlling Web Fonts with font display


Oh yeah, regardless of which Web Vital you’re optimizing for, don’t forget to optimize them on a per-page basis.

Conclusion: Give Your Users the Page Experience They Deserve

Are you giving your users a good page experience?

Because you should be.

Your users work hard. They have bills to pay. They have pandemics to fight. They occasionally forget to pick the kids up from school and then get yelled at. Starbucks baristas occasionally spell their name wrong. They order things from Amazon using 2-day shipping, and it takes four days to arrive. Sometimes they eat food from the back of the fridge even though it expired a month ago and predictably get sick. Let’s face it. Being a user ain’t easy. So play your part and show your users a good time when they come to your web page. They deserve it.

Ask yourself:

  • Is your page useful?
  • Is your page usable?
  • Is your page delightful?

Hopefully, you answered yes to all three.

If not, you need to do some serious reflecting on your web pages.

No one likes a janky web page.

Businesses should always be striving towards engaging their customers in a meaningful way. That’s just smart business. Now they just have just another reason to do so thanks to Google and its effort to control the universe.

So don’t let your users down (or Google).

Besides, you don’t really have a choice in the matter. Whether you like it or not, Google is instituting page experience as a ranking factor over the next year. So if you can’t beat ‘em, join ‘em and start optimizing today.

And remember….

May the Vitals be with you (and your web page).

Need some help getting there or have any other questions about page experience or really just life in general? We’re here to help. We can gauge the temperature of your Core Web Vitals, even if it means putting the thermometer where the sun don’t shine. That’s just the type of service we provide. (Don’t worry, we’re gentle – and white hat.) From there, we’ll then show you how to navigate these changes so you can have the healthiest, most delightful site out there. One that has every user this side of the SERP trying to click on it.

So hit us up.

Re-Invest Your Corporate Travel Budget – And Maximize Your ROI

Now that business travel has come to a halt, what should you do with your travel budget?

As we see it, there are three options:

  1. Save that money for when business trips are possible again.
  2. Allocate that money to another part of your business operation.
  3. Use that money as a toilet paper replacement.

As appealing as the first and last choices are, we recommend going with the second. And, more specifically, investing any unusable business travel spend into digital marketing.

That might seem counterintuitive.

However, consumers still need goods and services, and they are relying on the internet to find people to do business with. So, you want to make sure you’re there for them when they need you.

Throughout the Coronavirus outbreak (and resulting recession), we have been examining the best ways to weather, overcome, and even grow during the economic downturn and rapid changes in consumer habits. What we’ve found is that the best way to protect volatility is not to stifle spending.

Instead, refocusing spending during a recession is a safer bet.

This has been the running theme throughout our ongoing look at handling the Coronavirus recession, including:

As travel expenses fall by the wayside, we are similarly finding that rather than saving that money for when travel resumes or in preparation for other future uncertainties, it is better to use those funds to protect against present realities.

In other words, investing your travel spend dollars online is a smart move right now.

Comparing ROI: Travel Spend vs. SEO and Paid Media

According to Motus, the average business trip costs $1,293. Depending on your business, that might seem either high or low. But what is even more telling across the board is what we get in return for that spend.

To that end, Certify reports that from the 445 million business trips that occur each year, every dollar spent on travel provides:

  • $9.50 increase in revenue
  • $2.90 increase in profit

That calculates as a 190% ROI from business travel.

Numbers like those make nixing business trips due to Coronavirus, a hard pill to swallow.

But it doesn’t have to be.

We just need to find an equally lucrative revenue-generating channel to invest those temporarily defunct travel funds into. Ideally, one that is recession-proof, or close to it.

In a recession (or even non-recession for that matter), the primary goal of any business marketing strategy is to connect with a target audience. Which means you want to be where the customer is. As social distancing and quarantining are sending people indoors and online in record numbers, digital marketing is the best equipped to make that happen.

That’s why SEO and paid media are as close to a recession-proof strategy during the current economic downturn.

But are they enough to compensate for losses in business trip revenue?

Short answer: YES!

Slighter longer answer: Paid media campaigns provide an estimated 200% ROI. The ROI of SEO (although harder to accurately calculate) is equally, if not more impressive. According to one study, a well-strategized SEO campaign results in a 200-275% ROI.

In both instances, these two digital marketing channels exceed the typical ROI of business travel.

While we’re not saying that companies should scrap travel for digital marketing regularly, in times when business trips are an impossibility, allocating that budget into growing your online presence can be a great substitute.

Why Invest Travel Spend into Paid Media

The reaction to COVID-19 as impacted paid media advertising in the following ways:

  • More people on Google and visiting ad-rich sites.
  • Cost-per-click has decreased on average across many paid media verticals.
  • Competition has decreased, as many businesses pull back spending.

The factors above create an excellent opportunity to pick up market share.

As the crisis continues, both costs and competition are likely to continue decreasing. This means there has been no better time to use paid media advertising. Additionally, with online traffic volume skyrocketing, especially on news sites, display networks have become more valuable to digital marketers than ever.

To get the most out of your paid media ads, we recommend diversifying between two different targeting strategies:

  1. Target Strategy #1: High intent, longtail queries

This strategy involves monitoring trends closely (using Google Trends) to see how people are searching online at any given moment and see how people’s priorities and interests are changing. Google has also released Google trend Coronavirus Hub to further help track COVID-19 related search trends.

Once you find your keyword-rich search queries, identify which match your target audience with the highest likelihood to buy, and create messaging and content around those queries. Depending on your industry, this may require excluding COVID-19 related searches, such as:

  • Coronavirus
  • Corona
  • Covid
  • Virus
  • Pandemic
  • Epidemic

The key is being super specific with your keywords (hence the “longtail”) is to mine cheaper traffic with higher relevance.

  1. Target Strategy #2: Low intent, top-level funnel conversions

This strategy is a longer-term play focusing on macro conversions. The goal is to less make a sale in the now, which is becoming increasingly tricky as households reduce spending, and more to generate brand awareness, trust, and build remarketing lists. So instead of trying to overcome buyer hesitation forcefully, your brand tactfully positions itself top-of-mind when confidence returns, and people are more inclined to buy.

How each brand generates this goodwill and converts into marketing-qualified leads (MQLs) will vary. But it typically involves creating ads around industry-relevant, thought leadership content that provides value to your audience when facing the pain points associated with the Coronavirus.

Keep in mind, Google originally banned Coronavirus-related ads. But now they are starting to lift that ban so certain industries can start providing COVID-19 relevant messaging to their audience via paid media.

Why to Invest Travel Spend into SEO

One of the worst mistakes a brand can do right now is halt its SEO campaigns. Not only will you drop traffic, lose leads, miss conversions, and decrease revenue, but you’ll fall behind your competitors. Instead, while everyone else is either pulling back or keeping their SEO spends stagnate, you should boost yours with your “extra” travel budget.

Safeguarding against your competitors moving higher than you on search engine result pages (SERPs) will ensure that when the recovery occurs, you’re not playing catch up. It takes a fraction of the cost to maintain and improve rankings compared to the loss of revenue that arises from a SERP freefall.

So the smart move is to prevent that drop from ever happening.

This means strategizing your SEO campaigns around three types of searches:

  1. SEO Target Strategy #1: Current Search Habits

Very likely, your audience is most concerned right now with how Coronavirus will impact their lives and businesses. So a lot of their searches are focused around that topic. This means you should be creating and optimizing organic content around people’s current priorities and interests, as it relates to your business.

Just like with the first targeting strategy for paid media, we recommend monitoring Google Trends closely and generating time-relevant content that provides the answers to the queries your audience is currently seeking.

For example, there are a lot of people who planned a move during this time, and are concerned about how to do it safely. So in response, businesses like Moving.com and Pods have created SEO-centric content answering those concerns.

  1. SEO Target Strategy #2: Normal Search Habits

Eventually, the Coronavirus will be contained, and the economy will recover. When it does, consumer spending habits will stabilize. So you want to start preparing today for that surge.

Since SEO is a long-term strategy, unless you are targeting very time-sensitive queries, what you do today will affect your organic search several months from now. So continue your future SEO campaigns targeting the typical search habits of your audience. By increasing these efforts, using your unused travel spend, you can even gain an added boost by pressing on, while others are letting up.

  1. SEO Target Strategy #3: Local Searches

Local SEO might not apply to every business, but as our travel reduces and home quarantining increases, there is more of a need than ever for locally based services. So if your business relies on local search in any way, you will want to focus a large part of your immediate efforts on local SEO. This includes:

  • Optimizing for “near me” searches
  • Optimizing business info, address, and contact info on your site
  • Optimizing Google My Business
  • Optimizing local business directories like Angie’s List and Yelp

Also, be sure to stay up to date on changes made by Google as policies regarding reviews and new updates are constantly changing.

Conclusion: Put Your Corporate Travel Budget to Good Use with paid media marketing and SEO

Right now, every brand should be focused on two things:

  • Staying ahead of the competition
  • Preparing for the recovery bounce-back surge

Focusing on those strategies will position your business to do well during and after the Coronavirus recession. Which is why paid media and SEO are so important. They put your business on the offensive and defensive at the same time.

There is little to gain from unused travel spend. So instead, get the most bang for your buck by diversifying into these two bull markets

  • Paid media: A short-term opportunity that can produce immediate gains
  • SEO: A long-term safer bet that provides increasing dividends over time

By investing your otherwise unserviceable travel budget into these current low-cost, high-yield business strategies on Google, you can stay ahead of the competition, keep revenue flowing, and capture market share during the economic downturn.

That way, when things return to normal, and you can once again put that travel spend to good use, your business will be in the best position possible to take flight.