Google PageSpeed Insights. We’re guessing you’ve heard it. You’ve probably used it. You might have even spent a lot of time trying to score 100 on it. And yet there’s a good chance you still haven’t gotten the results you’re looking for.
We feel you. The struggle is real.
But we’re going to let you in on a little secret: Scoring 100 on Google PageSpeed Insights doesn’t really matter.

We’ll explain why in a moment.
But first, regather your blown mind and go ahead and analyze your site’s performance on Google PageSpeed Insights.
Take your time.
We’ll wait.

Together we’re going to dissect those PageSpeed Insights Report results to show you what they really mean and how you can use them to improve your business.
Notice, we said business, not website.
That’s an important distinction to make. Not making this distinction is where most go wrong with Google PageSpeed Insights.
In fact, a lot of people use PageSpeed Insights wrong.
Or at least, they don’t use it as best they could.
But no reason why you should be one of them!
Stop Chasing After 100 Scores on PageSpeed Insights
No matter how many blogs, marketing professionals, fortune cookies, horoscopes, SEO experts, or Ouija boards tell you otherwise, don’t waste your time chasing after a perfect score on PageSpeed Insights.
Really, when has chasing perfection not resulted in a massive letdown?
Only once that we know of.
And that was when Pizza Hut created the hot dog-stuffed crust pizza.

Good luck topping that.
Besides, optimizing for a 100 performance score is not in the best interest of your business.
While seeing a nice big 100 feels pretty awesome, it doesn’t automatically mean your online presence is well optimized to grow your business. It just means your website works nicely in Google’s opinion.
But you’re not here to impress Google (at least not 100% of the time). You’re here to grow your brand, revenue, and profit.
Riddle us this, why have it there at all if it doesn’t serve a purpose?
Well, for one, we relate more easily to a single rating, rather than multiple results. As proven by RottenTomatoes. (Sorry, it’s certified fresh or bust for us.)
Ask yourself, what’s more thrilling:
- Seeing the number “100” in a big, green icon
– or – - Seeing that your largest contentful paint is 1 second
The second one may be more important, but the first is green. GREEN!
But don’t be fooled by fancy colorful one-and-done ratings. They’re not always reliable. As proven by RottenTomatoes.
(Taken: 58%. The Notebook: 53%. Bad Boys II: 23%. Hook: 28% HOOK!? Bad form!)
Google PageSpeed Insights’ performance score is what we like to call a “vanity metric.” It looks good. It feels good. It’s easy to grasp. But ultimately, it doesn’t do you any favors. It’s basically the Krispy Kreme donut of performance metrics.

Far more useful are all the other less-exciting, slightly-confusing metrics that PageSpeed Insights throws at you, and most people ignore. These are the ones that will help you make sound business decisions.
Don’t get us wrong, scoring 100 on PageSpeed Insights is really good. If you can get there, you may be in a position to rank higher on Google. But at what cost?
The last thing you want is to spend a lot of resources trying to get a higher score that could have been better spent on other more valuable aspects of your business, like product development, advertising, content creation, or watching Ozark.
So here at Titan Growth, we always make the recommendation to our clients that they focus on improving the most important aspects of their PageSpeed Insight report, which does not include an ambiguous grade.
Point being, it’s very easy to get caught up chasing a perfect score on PageSpeed insights while forgetting the bigger picture.
Find the Right Performance Results for Your Business
All that said, we still get asked a lot:
What is the best Google PageSpeed Insight score for my site?
If you have your sights set on getting the best grade possible, find that perfect balance between improving performance and improving your business.
That balance usually lies right above your competitors.
When it comes to SEO, you’re not looking to win the Internet. Just beat your competitors. So if your webpages can outperform those of your competitors in SERP, you’re in a good place.
One of the great things about Google PageSpeed Insights is that anyone can use it for any site. So instead of chasing after a 100 Insight score, the following will far likely better serve your business:
- Identify your high traffic pages
- Analyze those webpages in PageSpeed Insights
- Analyze your competitor’s similar webpages
- Tally and compare the scores
- Optimize your webpage to have a higher score than your competitors
There’s a good chance you won’t need a 100 to outperform your competitors.
Whatever that number is that places you above them, that’s most likely what the ideal performance score is for your site.
But again, this is only if you absolutely feel the need to get a good grade. A far better strategy would be to focus on improving the more important metrics found within a Google PageSpeed Insights report.
Cue…
How to Read a PageSpeed Insights Report
Who doesn’t love reading reports?
Answer: Pretty much everyone.
Merely uttering the word is enough to turn the stomach and conjure images of having to sheepishly hand over our middle school report cards. Who knew F- was even a thing?
But don’t worry, reading a Google PageSpeed Insights report doesn’t have to be terrifying, humiliating, or boring.
Ok, well, they’re still pretty boring. It is a report after all.
But it can be less boring. Especially since if you read this report correctly, it can greatly benefit your business.
So let’s decipher these digital hieroglyphics, together, one section at a time.
Performance Score
This is the big number that appears at the top of the report. You know, the one we just said you can totally ignore.
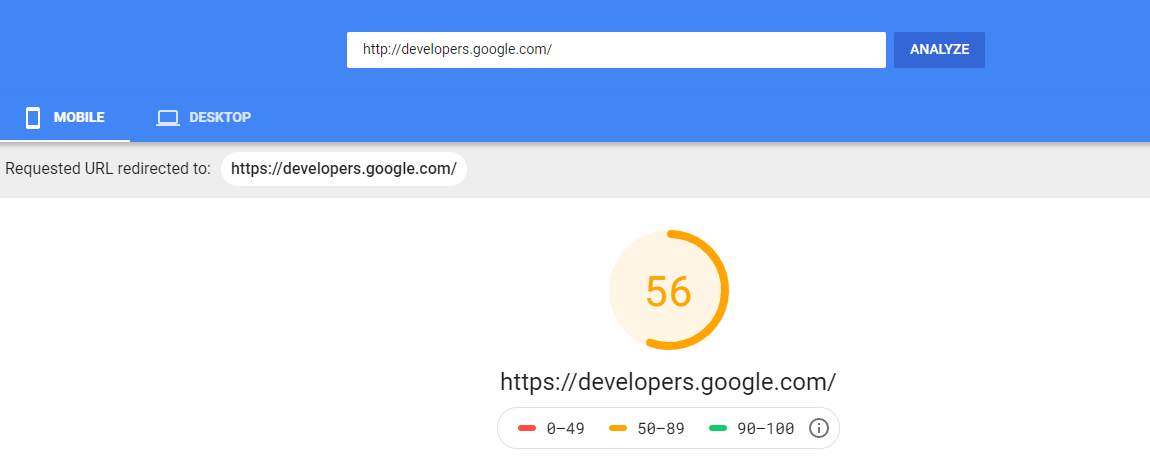
This score is determined by analyzing Lab Data (see below) and subjectively attributing a number score to the results. Google considers a score of 90 or above good. Anything from 50 to 90 needs improvement (even Google’s developer site could use a little work by their own standards). Anything below 50 is considered poor, or as we know it better as: an F-.
Field Data
Field Data is an aggregate collected from actual users who load and interact with your page. These metrics have been collected by Google over the past 30 days, and are averaged into a single total for four different categories:
- First Contentful Paint (FCP) – Measures how long it takes for the first content (like text or an image) to appear on screen.
- First Input Delay (FID) – Measures the time between when a user first interacts with a page (like clicking a link or tapping a button) to when the browser responds to that interaction.
- Largest Contentful Paint (LCP) – Measures how long it takes the largest content element (like an image, video, or text block) to appear.
- Cumulative Layout Shift (CLS) – Measures a page’s stability, and whether there are any visible page element changes position (or shift) at any time.
The multi-colored bar that appears beneath breaks down how the final tally was reached, and what percentage of page loads within the past 30 days were either good (green), not so good (orange), or poor (red).
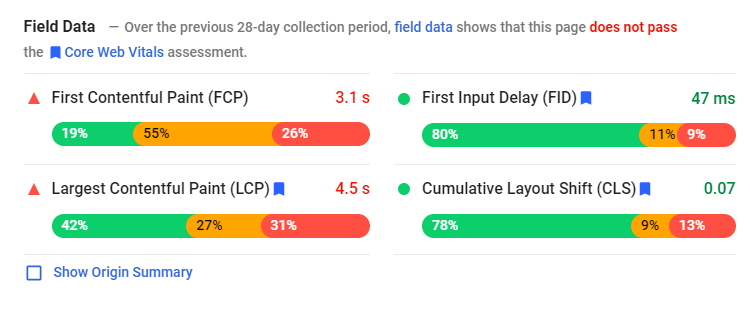
The tallies for these categories are far more important than that generic performance score at the top of the report. Ideally, your page should have the following for each:
- First Contentful Paint of 1 second or less
- First Input Delay of 100 milliseconds or less
- Largest Contentful Paint of 5 seconds or less
- Cumulative Layout Shift of 1 or less
If it does, then what are you still doing here? You should be out on the town partying it up like an SEO rockstar. If it doesn’t, keep on reading, we’ve got some work to do.
The latter three metrics comprise what is known as your Core Web Vitals. Google lets you know plain and simple whether your page experience is up to snuff by listing whether it “passes” or “does not pass” its Core Web Vital test.

What does it mean if your page doesn’t pass?
Well, you probably shouldn’t show this report to your parents for one.
Core Web Vitals are the ranking signals Google users to determine page experience, which is kinda big thing. So big, in fact, we wrote an entire guide on everything you need to know about page experience and Core Web Vitals. That guide also shows how to optimize for Web Vitals. So if your numbers are less than ideal, be sure to check it out.
Origin Summary
You probably ignore this section every time. Don’t. It’s a great reference.
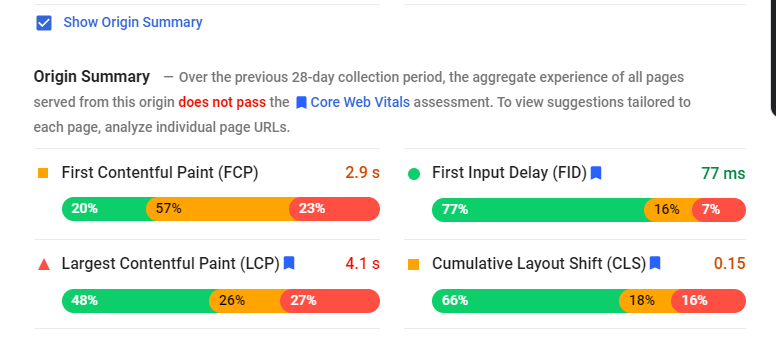
When you enter a URL into Google PageSpeed Insights, the results pertain only to that unique page. To get sitewide performance data, you need to look at the Origin Summary.
Check the “Show Origin Summary” box to view the average loading speeds across your entire site. You can then compare these results to the Field Data of a specific page to see if that page performs better or worse than your site as a whole.
Use this to benchmark pages, and prioritize which need the most help while using your site’s best-optimized pages as a reference for pages that need better optimizing.
Lab Data
Lab Data are metrics taken from a simulation of how your page loads on a single device under a fixed set of conditions. Think of it as the control group of testing your page.

Lab Data consists of:
- First Contentful Paint (FCP)
- Time to Interactive (TTI) – Measures how long it takes for a page to become fully interactive. An ideal result is 8 seconds or less.
- Speed Index – Measures how quickly the content of a page appears. An ideal result is 3 seconds or less.
- Total Blocking Time (TBT) – The total amount of time a page is blocked from responding to user input, such as mouse clicks, screen taps, or keyboard presses. An ideal result is 300 milliseconds or less.
- Largest Contentful Paint (LCP)
- Cumulative Layout Shift (CLS)
You’ll notice that some of those categories are shared between Field Data and Lab Data, but most likely show different results on your report.
The Difference Between Lab and Field Data, and Why You Should Care
In a nutshell, Field Data is collected from users. Lab Data is generated by a Google algorithm.
But the more-telling difference is found with two factors:
- Perceived Performance – How fast a user thinks your website is
- Actual Performance – How fast your technical stats say it is
Field Data focuses on conveying perceived performance, while Lab Data more closely aligns with actual performance. Which means if you were to only care about one of these, you would want Field Data. That’s because when it comes to SEO and optimizing your webpages, it’s what the user thinks that really matters, not the technical wizardry going on behind the scenes.
That comes straight from the horse’s mouth. According to Google, Field Data is more reliable and “probably a better indicator for how real users are experiencing your website than lab data.”
But don’t totally ignore Lab Data.
Actually, it’s impossible to ignore it on the PageSpeed Insight report because the Performance Score at the top, and Audit sections below, are based solely on Lab Data.
Knowing this is really helpful in deciphering which performance metrics Google prioritizes when ranking sites. Google might not be an open book on the 200+ ranking signals it uses, but it is transparent about how they weight Performance Score.
 Check out this nifty scoring calculator to see how each component impacts the overall score.
Remember, Performance Score is Google’s arbitrary opinion of your page’s speed. And since Google dictates who ranks where in their search engine, based on that table above, they care a lot more about Total Blocking Time and Largest Contentful Paint, than say Cumulative Layout Shift. So don’t spend all your time fixing wonky content shifts over improving your pages’ response time.
Taking this one step further, when prioritizing your SEO workflow, we recommend:
- First, optimize your site for the Field Data (going from highest weighted to lowest)
- Then, optimize your site for the Lab Data (going from highest weighted to lowest)
One final note: Since your page and that of a competitor likely get completely different visitors, there are too many variables to accurately say which performs better by looking just at Field Data. However, Lab Data tests both pages in the same exact environment and presents a more accurate comparison between the two.
So we recommend using Lab Data (over Field Data) when performing competitor analysis.
Alrighty then. Now that we know all there is to know about the data in our report, let’s see how to improve it.
The Best Ways to Address Google’s Performance Audits
When running a Google PageSpeed Insights test, most people:
- Look at their Performance Score, and get either really happy or sad
- Scroll right past the Field Data and Lab Data as fast as they can
- Dive headfirst into fixing everything spit out in the Audit sections
Because who doesn’t love being audited?
Answer: Pretty much everyone.

We do, however, like being given solutions. So, the audit section gets all the glory while the data sections get ignored, just like the kid nobody wants on their kickball team.
The three sections that comprise the PageSpeed Insight audit are:
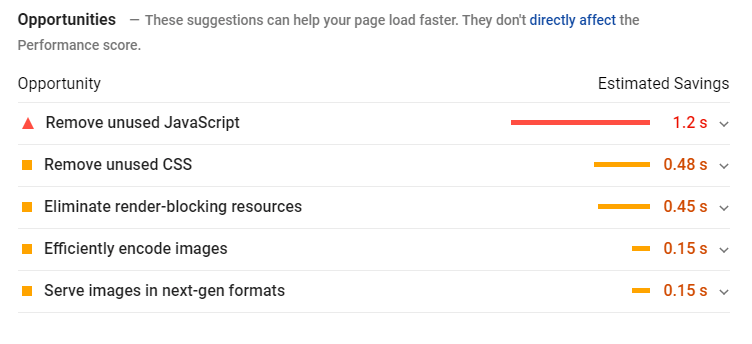
Opportunities – Provides suggestions on how to improve page load time. The tallies next to each are an estimate of how much that issue is impacting your overall page load.
Diagnostics – Assesses specific aspects of page performance, with recommendations for optimization.
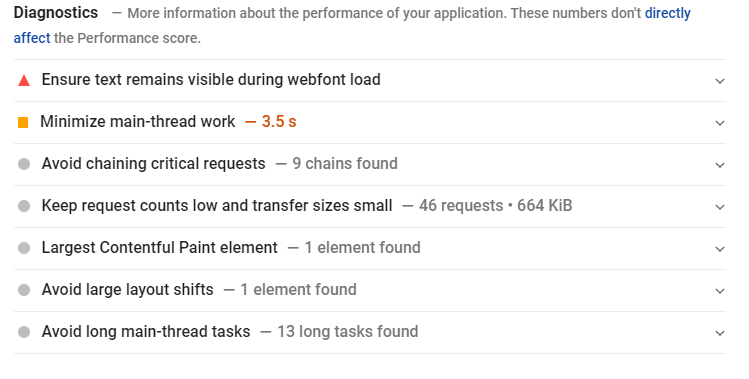
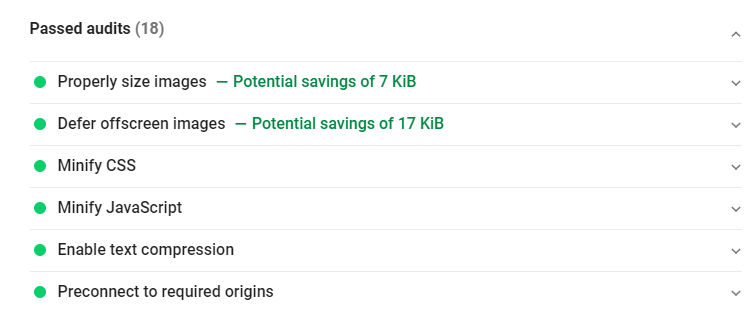
Passed Audits – Indicates the audits that have been passed by a page.
First and foremost, don’t break your back trying to fix every single item listed in the Opportunities section. You’ll likely drive yourself mad trying to shave off milliseconds.
Instead, use these suggestions as a guide to see what areas you should focus on.
For instance, if you see any issues related to images under “Opportunities,” rest assured it’s because you’re not optimizing your images as best you should. But don’t worry about figuring out how to “efficiently encode images” or “service images in next-gen formats.” All you should care about is optimizing your images using best practices before uploading them to your site (and avoid using widgets like those that display your Instagram feed).
Nine times out of ten, that will suffice for resolving image issues.
(For those confused about “next-gen formats”: Google has decided on behalf of the Internet that JPEG, PNG, and SVG images are no longer good enough. So, they push the use of more modern, higher-compressed versions that very few people have ever heard of. However, next-gen formats aren’t supported by every browser and are complicated to convert to. Making this is a perfect example of why chasing after a Google-recommended solution is not always the best course of action.)
With that in mind, we recommend referring to the following tutorials to improve load time (and your page’s actual performance):
As well as the following to improve page experience (and your page’s perceived performance):
The reason we recommend heading straight to those tutorials, rather than explaining what each line item in the audit means, is because, at the end of the day, Google PageSpeed Insights is not the end-all-be-all of your SEO strategy.
It is a report. A mere snapshot of your page performance.
If we focus solely on implementing the report’s recommendations instead of zeroing in on what the data is telling us, we miss the point.
Conclusion: PageSpeed Insights Is About Your Business, Not Google Rank.
As hard as it is to believe, Google is not the authority on webpage performance. Nor are they the authority on your customers. PageSpeed Insights is a testament to that. The scores are subjective, and the audit recommendations are based on Google’s own preferences.
Google PageSpeed Insights is, however, a great reference. It is a tool, a means to an end, that can help you determine how to optimize your webpages to create the best experience possible.
There is a reason why it’s not called Google Engine Optimization. (Although some days, it can feel like it!)
SEO is about more than just appearing higher in a Google search result. It’s about optimizing your online presence to best engage your brand’s target audience.
So use the data in your Google PageSpeed Insights report to help you do just that.


